
The global foreign exchange market is the largest and most liquid financial arena on earth. According to data from the Bank for International Settlements Triennial Central Bank Survey, global foreign exchange turnover reached an unprecedented record high of 9.5 trillion USD per day on average, showing a 27% increase compared to previous survey periods. This massive liquidity pool makes it highly attractive for retail traders, institutional funds, and corporations alike.
To navigate this market successfully, you must master currency pairs and market structure. Unlike equity markets where you buy shares of a single company, forex trading involves the simultaneous purchase of one currency and the sale of another.
Anatomy of a Currency Pair
Every trade in the forex market is executed through a currency pair. This dual structure represents the relative value of one nation’s currency against another.
The Base and Quote Currencies
- The Base Currency: This is the first currency listed in the pair. It always represents exactly 1 unit. For example, in the EUR/USD pair, the Euro is the base currency.
- The Quote Currency: Also known as the counter currency, this is the second currency in the pair. It represents the amount of that currency needed to purchase 1 unit of the base currency. If the EUR/USD pair is trading at 1.0850, it means you must pay 1.0850 US Dollars to buy 1 Euro.
How Price Movements Work
When you open a buy position (going long), you expect the base currency to strengthen against the quote currency, causing the exchange rate to rise. Conversely, when you open a sell position (going short), you expect the base currency to weaken, causing the exchange rate to fall.
Live Macro Environment Simulator
Adjust central bank policy yields and trade environments to see their direct structural impact on interbank spreads, liquidity tiers, and retail trading quotes.
The Three Categories of Currency Pairs
The foreign exchange market categorizes currency pairs based on their trading volume, liquidity, and regional economic characteristics. Understanding these classifications helps traders manage transaction costs and volatility.
1. Major Currency Pairs
The majors are the most heavily traded pairs in the world, and they always feature the US Dollar on one side of the transaction. The US Dollar remains the absolute dominant force in global finance, appearing on one side of approximately 90% of all foreign exchange transactions globally.
The major pairs include:
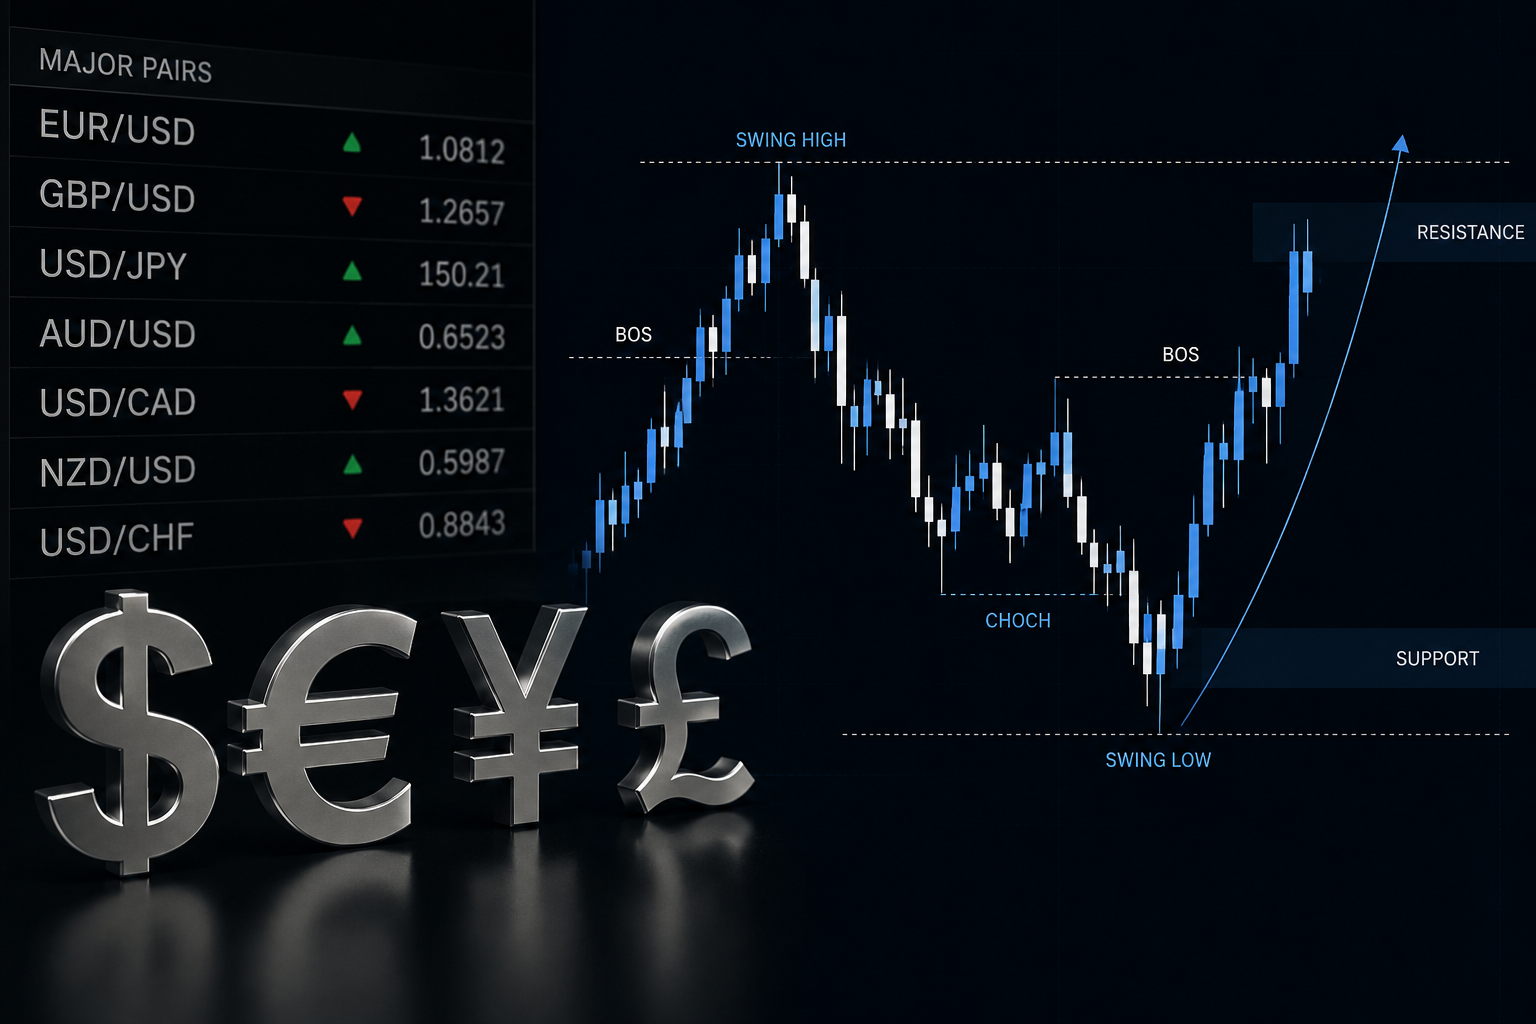
- EUR/USD: Euro vs. US Dollar (The most heavily traded pair)
- GBP/USD: Great British Pound vs. US Dollar (Cable)
- USD/JPY: US Dollar vs. Japanese Yen
- USD/CHF: US Dollar vs. Swiss Franc
- AUD/USD: Australian Dollar vs. US Dollar
- USD/CAD: US Dollar vs. Canadian Dollar
- NZD/USD: New Zealand Dollar vs. US Dollar
Because of their immense liquidity, major pairs offer the tightest spreads, making them ideal for day traders and scalpers who require low transaction costs.
2. Minor and Cross-Currency Pairs
Pairs that do not include the US Dollar are known as crosses or minors. Historically, if you wanted to exchange Euros for Japanese Yen, you had to convert Euros to US Dollars first, and then US Dollars to Yen. The creation of cross pairs eliminated this intermediary step.
Popular crosses include:
- EUR/GBP: Euro vs. Great British Pound
- EUR/JPY: Euro vs. Japanese Yen
- GBP/JPY: Great British Pound vs. Japanese Yen (Known for high volatility)
- AUD/NZD: Australian Dollar vs. New Zealand Dollar
Minor pairs typically exhibit slightly wider spreads than majors, but they can present excellent trend-following opportunities due to regional macroeconomic differences.
3. Exotic Currency Pairs
Exotic pairs consist of one major currency paired with the currency of a developing or emerging market economy.
Examples include:
- USD/TRY: US Dollar vs. Turkish Lira
- USD/MXN: US Dollar vs. Mexican Peso
- USD/ZAR: US Dollar vs. South African Rand
Exotic pairs carry distinct characteristics that retail traders must watch closely:
- High Spreads: Due to lower liquidity, the transaction costs are significantly higher than majors.
- Extreme Volatility: Exotics are highly sensitive to sudden political shifts, changes in global risk sentiment, and tariff announcements.
- Gap Risk: Price charts for exotics frequently experience gaps over weekends or during illiquid market hours.
Forex Market Structure: The Decentralized Network
Unlike the New York Stock Exchange or the Tokyo Stock Exchange, the forex market does not have a physical location or a central clearinghouse. Instead, it operates as an Over-The-Counter (OTC) decentralized network of interconnected participants.
The Interbank Market
At the very top of the forex market structure sits the Tier 1 Interbank Market. This is an exclusive network where the world's largest commercial banks (such as JPMorgan Chase, Citibank, Deutsche Bank, and HSBC) trade directly with one another or through electronic brokering platforms like EBS or Reuters.
The interbank market determines the core exchange rates that trickle down to the rest of the world. Transactions at this level are massive, often involving tens or hundreds of millions of units per trade.
Central Banks
Central banks like the Federal Reserve (Fed), the European Central Bank (ECB), and the Bank of Japan (BoJ) wield immense power over the market structure. They do not trade to make a commercial profit; instead, they manage monetary policy, adjust interest rates, and occasionally intervene directly in the currency markets to stabilize their national economy.
Non-Bank Financial Institutions and Corporates
This layer includes hedge funds, pension funds, insurance companies, and multinational corporations (like Apple or Toyota) that need to hedge foreign exchange exposure arising from global trade or international assets. Institutional spot turnover has surged dramatically, with spot and forward trading driven heavily by non-reporting banks and asset managers expanding their international footprint.
Retail Forex Brokers
Retail traders cannot access the interbank market directly. Instead, retail forex brokers act as intermediaries. They aggregate liquidity from Tier 1 and Tier 2 banks and present it to retail clients via trading software like MetaTrader or cTrader.
Forex Market Share and Instruments
To understand where liquidity flows, it helps to examine how trading volume is distributed across different currencies and financial instruments.
Global Currency Share
The table below highlights the global daily average turnover share for the top world currencies, demonstrating the clear dominance of the US Dollar, Euro, and Japanese Yen.
| Currency | Daily Average Turnover (Billions USD) | Share of Total Market % |
| US Dollar (USD) | 8,550 | 90.0% |
| Euro (EUR) | 2,714 | 28.5% |
| Japanese Yen (JPY) | 1,608 | 16.9% |
| Great British Pound (GBP) | 967 | 10.2% |
Note: The total percentage equals 200% because every transaction involves two distinct currencies.
Turnover by Financial Instrument
Forex trading is not limited to spot transactions. The market structure includes several derivatives that institutions use for hedging or speculation.
Foreign exchange swaps remain the most traded instrument globally, accounting for 42% of total turnover, while spot transactions and outright forwards make up the bulk of the remaining volume. Notably, currency options have surged significantly, doubling their share to 7% due to heightened volatility in the global macro environment.
Global Market Centres and Time Zones
The decentralized nature of forex allows it to operate 24 hours a day, five days a week. Trading follows the sun, moving across major financial hubs around the globe. Global FX trading is highly concentrated within major financial centres, with the United Kingdom and the United States together accounting for nearly 60% of global daily turnover. Meanwhile, Asian hubs like Singapore continue to grow rapidly, securing an 11.8% share of global volume.
The Four Main Trading Sessions
- The Sydney Session (Asian): Kickstarts the trading week. It features relatively lower volume and tighter trading ranges, focusing primarily on the Australian and New Zealand Dollars.
- The Tokyo Session (Asian): Represents the main Asian session. Volume increases as Japanese financial institutions, exporters, and central bank operations go live.
- The London Session (European): The largest and most volatile session of the day. London acts as the historic capital of global foreign exchange, injecting massive liquidity into the market. Spreads contract heavily during this time.
- The New York Session (American): The final major session of the day. Volume is intense, driven by major US economic releases and equity market openings.
The Power of Session Overlaps
The absolute best trading opportunities typically occur when two major sessions overlap. During these windows, the volume of active participants doubles, leading to strong trends and high liquidity.
The London and New York overlap (typically 13:00 to 17:00 UTC) is the most explosive period of the trading day. More than half of all daily spot transactions occur during this four hour window because both European and North American institutions are active at the same time.
Current Market Drivers: Macro Shocks and Tariff Dynamics
The forex market structure is heavily impacted by geopolitical shifts and policy developments. Sudden policy shifts, such as the implementation of reciprocal tariffs, can radically alter global capital flows.
Tariff Announcements and Dollar Volatility
A clear example of this occurred following major US reciprocal tariff announcements. These events immediately sparked widespread fears of an economic downturn and structural shifts in international trade, causing rapid spikes in foreign exchange volatility.
The initial impact resulted in an uncharacteristic breakdown of long standing correlations: the US Dollar depreciated sharply against major safe havens like the Japanese Yen, pushing the USD/JPY rate down rapidly from the upper 149 yen level to the lower 143 yen level in a matter of days. At the same time, global fund managers were caught underhedged due to previous monetary policy tightening, forcing an unprecedented wave of spot and options hedging that drove the daily volume to its 9.5 trillion USD record.
Impact on Emerging Markets
The ripple effects of global trade tension and regional conflicts, such as geopolitical friction in the Middle East, show how fragile liquidity can be across different currency tiers. While major pairs like EUR/USD handle these shocks smoothly due to their massive structural liquidity, emerging market pairs react with extreme instability.
Research tracking cumulative average abnormal returns shows that currencies heavily exposed to global trade exposure, like the Mexican Peso (MXN) and Indian Rupee (INR), suffer sharp, long term depreciation trends following global policy adjustments. Conversely, tightly integrated economies like Canada show minimal abnormal currency reactions, proving that deep economic integration shields certain pairs from structural volatility.
Actionable Strategy: Trading Market Structure Shifts
To exploit market structure effectively, retail traders must look beyond simple technical indicators and learn to identify where major institutional orders are clustered.
Step-by-Step Institutional Level Execution
1.Identify the Macro Trend and Session Anchor: Pre-Market Planning.
Check the economic calendar for high impact releases like Central Bank interest rate decisions or inflation reports. Identify whether the current sentiment is Risk-On or Risk-Off. Wait for the London session open to establish the true directional bias for the day, as this is where institutional liquidity pools become active.
2.Locate Liquidity Pools (Support & Resistance): Chart Analysis.
Look at the daily and 4 hour charts to identify major swing highs and swing lows. These levels represent structural support and resistance where large clusters of institutional stop-loss orders and pending buy/sell limits reside. Avoid entering trades in the middle of a consolidation range.
3.Watch for the Stop Hunt (Liquidity Sweep): Pattern Confirmation.
Institutions need massive counterparties to fill their large positions. Watch for price to briefly break past a prominent support or resistance level, triggering the stop losses of retail traders. If the price quickly reverses and closes back inside the previous range, a liquidity sweep has occurred.
4.Execute with Strict Risk Management: Trade Entry.
Enter your position immediately after the candlestick closes back within the structural level, confirming the rejection. Place your stop-loss order just outside the newly formed swing high or low. Ensure your profit target is placed at the opposite side of the structural range, securing a minimum 1:2 risk to reward ratio.
Summary and Next Steps
Mastering currency pairs and market structure is the foundational bedrock of a professional trading career. By shifting your perspective away from isolated chart lines and looking at forex as an interconnected, decentralized network driven by central bank policies, institutional hedging, and global trade flows, you position yourself far ahead of the average retail participant. Always tailor your risk to the specific liquidity profile of the pair you are trading, and keep a watchful eye on macro trade developments to stay on the right side of institutional order flow.
To build a comprehensive understanding of the structural components of global finance, you can explore the Bank for International Settlements for data on market turnover, or check out the Federal Reserve Economic Data to monitor the macro indicators driving currency valuation.