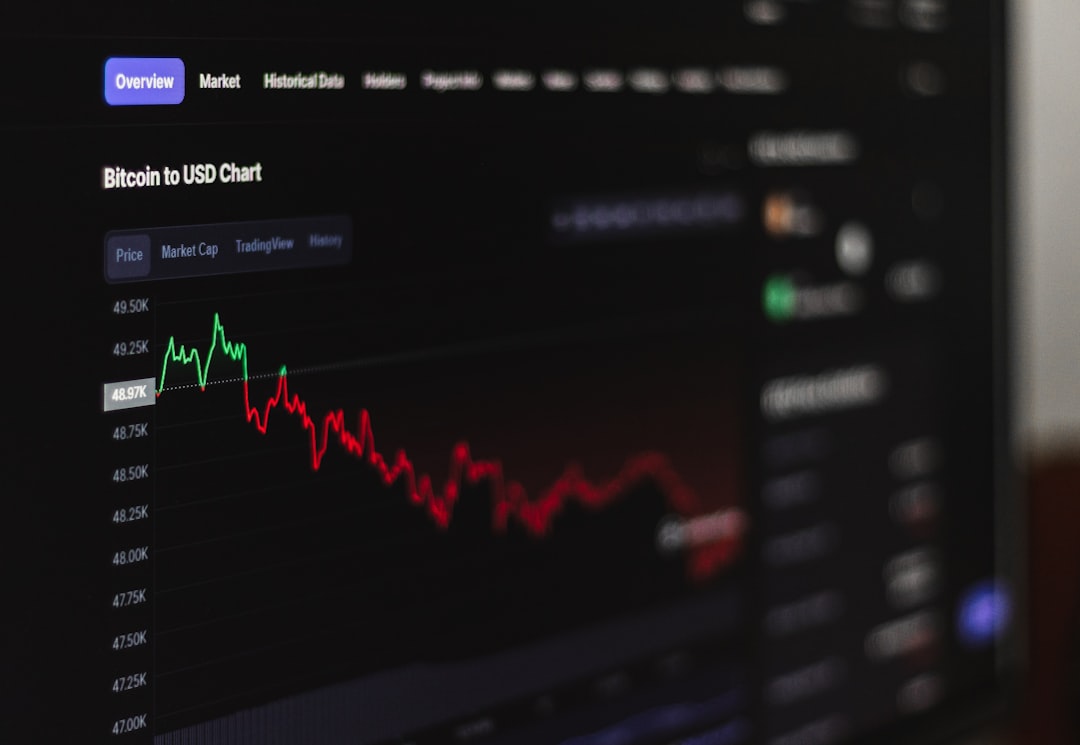
In 2026, trading is no longer a guessing game driven by instinct. Artificial intelligence now powers an estimated 89% of global trading volume. Algorithmic systems, machine learning signals, and alternative data have become standard tools not just for hedge funds but for informed retail traders. This guide walks through every major modern trading strategy in use today, from trend following and mean reversion to AI-driven quant systems and options volatility plays, and ties each one to the current market environment: a resilient S&P 500 near 7,500, a hawkish new Fed Chair Kevin Warsh, elevated energy prices tied to Iran conflict, and a technology sector leading earnings growth at 55% year over year. Whether you trade stocks, futures, crypto, or forex, this is the strategic framework you need for the second half of 2026.
Trading in 2026 demands an unusually high degree of situational awareness. Markets are simultaneously rewarding AI-fueled earnings growth, pricing in geopolitical risk from the U.S.–Iran conflict, and recalibrating to a new Federal Reserve leadership regime that has introduced renewed uncertainty about the path of interest rates.
The S&P 500 entered the year at a forward price-to-earnings ratio of 22, one of the most expensive valuations on record, yet has still managed to gain approximately 9% year to date through mid-June, lifted by spectacular earnings results. In the first quarter, S&P 500 companies reported earnings growth of 29%, the fastest pace since 2021, with technology and communication services leading at 55% and 49% respectively. JPMorgan Chase raised its year-end target to 7,800, implying roughly 5% additional upside from current levels around 7,500.
The biggest single macro variable for traders is the Federal Reserve. New Fed Chair Kevin Warsh, who succeeded Jerome Powell in 2026, has struck a notably more hawkish tone. His inaugural press conference in June sent shockwaves through equity and bond markets after nine of 18 Fed officials signaled rate hikes could be on the table, and Warsh abstained from submitting his own rate forecast entirely, a move markets interpreted as a signal of policy uncertainty. The fed funds target range sits at 3.50% to 3.75%, while the 10-year Treasury yields 4.48%. Inflation, as measured by the PCE Price Index, remains at 3.8%, well above the Fed’s 2% target.
Energy markets add a second layer of complexity. The U.S. military attacked Iran in late February 2026, sending crude oil to its highest level since Russia’s invasion of Ukraine in 2022. Crude prices now carry an estimated 60% scarcity premium above historical baseline, according to Fidelity. Energy and materials are the two best-performing S&P 500 sectors year to date. At the same time, technology’s 27% run over just three months has created crowded positioning in AI and semiconductor names, with Tuesday’s sharp sector selloff illustrating how quickly momentum can reverse when consensus positioning gets extreme.
+9%
S&P 500 YTD gain through June 2026
+29%
Q1 2026 S&P 500 earnings growth vs prior year
3.8%
PCE inflation rate, above the Fed’s 2% target
The AI Trading Revolution: Key Statistics
The most important structural fact about markets in 2026 is this: the vast majority of trading volume is no longer generated by human decisions. AI and algorithmic systems now power an estimated 89% of global trading volume. In U.S. equities and futures, a substantial majority of all order flow is computer-generated. In foreign exchange, markets have been heavily algorithmic for over a decade. Crypto, born digital, is essentially fully algorithmic at the venue level.
The AI in trading market reached $27.85 billion in 2026 and is projected to grow to $45.74 billion by 2030 at a compound annual growth rate of 13.2%. The automated algorithmic trading segment mirrors this growth, sitting at $27.17 billion and poised to exceed $44 billion within the same window. High-frequency trading alone handles 60% to 70% of U.S. stock trades in 2026, using AI to execute on microsecond timescales where human reaction is physically impossible.
What has changed most dramatically in the past two years is access. Technology that was exclusive to top-tier hedge funds five years ago is now available through cloud platforms, broker APIs, and SaaS trading tools. A single quantitative researcher in 2026 can evaluate more strategies in a week than a team could assess in a month a decade ago. But this democratization cuts both ways: more traders with AI tools means more competition for the same edges, and more rapid iteration without statistical discipline produces overfit strategies rather than durable alpha.
AI in Trading: Market Size Growth 2020 to 2030 ($ Billions)
AI in Trading market size forecast. Source: multiple industry analysts, 2026. 13.2% CAGR projected through 2030.
Trend Following and Momentum Strategies
Trend following is the oldest systematic trading strategy and, in many respects, still one of the most reliable. The core logic is simple: assets that have been rising tend to continue rising, and assets that have been falling tend to continue falling. This momentum effect is one of the most robust documented anomalies in financial markets and has been shown to persist across decades, asset classes, and geographies.
In 2026, trend following strategies have found fertile ground in a market defined by persistent sector divergence. Energy and materials have trended higher all year on supply constraints tied to the Iran conflict. Technology, after months of uptrend, showed signs of exhaustion in mid-June as AI and semiconductor positioning became dangerously crowded. Skilled trend traders using momentum filters recognized both the energy breakout early in the year and the emerging reversal signal in chip stocks before Tuesday’s sharp sector selloff.
Key Trend Following Techniques
Moving average crossovers remain the most widely deployed trend signal. A 50-day and 200-day simple moving average crossover generates a “golden cross” buy signal or a “death cross” sell signal when the short-term average crosses above or below the longer-term average. More sophisticated implementations use exponential moving averages that weight recent prices more heavily, reducing lag in fast-moving markets.
Breakout strategies are a second major trend-following technique, triggering entries when a price moves decisively above a defined resistance level or below support, signaling the beginning of a new directional move. In 2026, energy sector breakouts in February and March offered textbook examples of sustainable breakout momentum as oil supply concerns built cumulatively over weeks.
Relative strength ranking is a portfolio-level approach used by systematic trend followers and commodity trading advisors (CTAs). At regular intervals, typically monthly, the system ranks all assets in the universe by recent return and allocates to the top performers while going flat or short on laggards. This approach has historically worked well during macro-driven market regimes like the current one, where geopolitical and monetary factors create extended directional moves across sectors and asset classes.
?
2026 Application
In the current environment, trend followers are watching energy, materials, and select industrials to the upside, while monitoring AI-adjacent semiconductor names for signs of mean-reversion after a 27% three-month run. The VIX near 19.5 suggests enough uncertainty for trends to develop but not the kind of extreme volatility that makes signals unreliable.
Mean Reversion Strategies
Mean reversion strategies bet on the opposite logic of trend following: prices that have moved too far in one direction will snap back toward their historical average. While trend following works best in directional, macro-driven markets, mean reversion tends to perform in range-bound conditions and during post-spike exhaustion phases.
The statistical basis for mean reversion lies in the concept of cointegration: certain pairs of assets or an asset and its fundamental fair value tend to stay within a predictable spread of each other over time. When a deviation occurs, either due to overreaction to news, thin liquidity, or forced selling, reversion traders enter positions that profit from the correction back toward equilibrium.
Pairs Trading
Pairs trading involves identifying two historically correlated assets (such as Coca-Cola and Pepsi, or crude oil and natural gas) and trading the spread between them when it widens beyond its historical norm. The strategy is market-neutral in the sense that it profits from the relative movement between the two assets rather than the direction of the market itself. In 2026, pairs traders have found opportunities in the energy sector, exploiting divergences between upstream producers and refiners that widened during the Iran supply shock.
Statistical Arbitrage
Statistical arbitrage (stat arb) extends pairs trading to baskets of assets and uses quantitative models to identify and exploit pricing inefficiencies across many positions simultaneously. The strategy requires sophisticated data infrastructure and fast execution but can generate consistent returns with low correlation to market direction. Most large hedge funds run some form of stat arb as a core strategy.
RSI and Bollinger Band Mean Reversion
For retail and semi-professional traders, oscillator-based mean reversion using tools like the Relative Strength Index (RSI) and Bollinger Bands offers a practical implementation. An RSI reading below 30 signals oversold conditions, while a reading above 70 signals overbought. Bollinger Band contractions and expansions identify periods of compressed volatility followed by potential directional moves. Both indicators require supporting context to avoid fighting genuine trends, and are most reliable in assets that have historically traded in identifiable ranges.
Algorithmic and Quantitative Trading
Algorithmic trading refers to any strategy that uses a computer program to execute trades based on predefined rules. Quantitative trading specifically applies mathematical models, statistics, and data science to identify edges. In 2026, the distinction between the two has largely collapsed: nearly all serious algorithmic systems incorporate quantitative research, and most quantitative strategies are algorithmically executed.
Quantitative trading desks at hedge funds and prop firms now operate hundreds or thousands of strategies in parallel. The firms that dominate this space, including Renaissance Technologies, Citadel, Two Sigma, and DE Shaw, represent concentrations of talent, proprietary data, and computing infrastructure that individual traders cannot realistically match. However, the insights underlying quantitative trading are fully accessible, and retail-accessible platforms have made systematic trading genuinely practical for informed individual investors.
TF
Trend Following / CTA
Medium to Long Horizon
Captures extended directional moves in equities, commodities, currencies, and rates. Relies on moving averages, breakouts, and momentum ranking. Works best in macro-driven regimes like 2026.
Typical Holding PeriodWeeks to months
MR
Mean Reversion / Stat Arb
Short to Medium Horizon
Exploits temporary mispricings between correlated assets or price deviations from historical ranges. Requires careful regime detection to avoid fighting genuine trends.
Typical Holding PeriodHours to days
AI
AI / ML Signal Generation
Any Horizon
Uses machine learning to find non-linear relationships in price, alternative data, and news sentiment. Hybrid models combining RL, NLP, and technical signals outperform static rule-based systems in volatile regimes.
Complexity LevelHigh
OPT
Options / Volatility
Event-Driven and Income
Sells or buys optionality based on implied versus realized volatility expectations. Covered calls, cash-secured puts, and iron condors are widely used income-generating strategies in the current market.
Primary EdgeVolatility mispricing
MAC
Macro / Sector Rotation
Quarterly to Annual Horizon
Shifts capital between sectors and asset classes based on macroeconomic factors: interest rates, inflation, commodity cycles, and monetary policy. Critical in 2026 given elevated Fed uncertainty.
Primary DriverMacro data and policy
HFT
High Frequency Trading
Microsecond Horizon
Uses co-located servers and sub-millisecond execution to capture tiny spreads at massive volume. Not accessible to retail traders but dominates institutional order flow, handling 60% to 70% of U.S. equity volume.
Typical Holding PeriodMicroseconds to seconds
Core Algorithmic Strategy Families
Strategy
Market Type
Execution Speed
Skill Level
Best Assets
Retail Accessible
Momentum / Trend
Trending
Daily
Beginner
Equities, Futures, ETFs
Yes
Mean Reversion
Range-bound
Intraday
Intermediate
Forex, Equities
Yes
Pairs / Stat Arb
All regimes
Intraday
Advanced
Equities, Futures
Partial
ML Signal Generation
All regimes
Varies
Expert
All asset classes
Partial
Options Volatility
Range or catalyst
Daily to weekly
Advanced
Equities, ETFs
Yes
Macro Rotation
Regime transitions
Weekly to monthly
Intermediate
Sectors, Commodities
Yes
VWAP / TWAP Execution
All
Intraday
Intermediate
Large equity orders
Partial
High Frequency Trading
All
Microseconds
Institutional
Equities, Futures
No
AI and Machine Learning in Trading
Machine learning has migrated from academic research to live trading infrastructure at remarkable speed. The most consequential trend in 2026 is the deeper embedding of ML into the signal generation and research layers of trading systems. Hybrid strategies that blend reinforcement learning, natural language processing, and traditional technical indicators consistently outperform static rule-based systems during regime shifts, which is precisely the kind of environment traders face in mid-2026.
Large Language Models for Market Intelligence
Beyond traditional machine learning, large language models (LLMs) are increasingly used to parse earnings calls, regulatory filings, Federal Reserve communications, and news in real time. When Warsh abstained from submitting a rate forecast during his inaugural June press conference, LLM-powered systems flagged the anomaly within seconds and generated signals ahead of the manual read by most market participants. For earnings analysis, LLMs can process transcripts, identify tone shifts, and extract forward guidance nuances faster than any human analyst.
Reinforcement Learning for Dynamic Strategy Adaptation
Reinforcement learning systems continuously adapt to changing market conditions through a reward-and-penalty feedback loop, making them particularly suited for 2026’s shifting regime environment. Unlike supervised ML models trained on historical patterns that may no longer apply, RL agents update their trading behavior as the market evolves. This is especially valuable in 2026 when the transition from the Powell Fed era to the Warsh era represents a genuine regime shift in monetary policy communication and risk management.
Alternative Data as Signal Input
Alternative data, including satellite imagery of oil storage facilities, credit card transaction data, web search trends, job posting volumes, and social media sentiment, has become a standard input for institutional ML models. Retail platforms now offer some of this data through aggregated products, though the signal decay from wide availability is a real concern: once alternative data becomes universally accessible, the edge it provides diminishes as everyone acts on the same information simultaneously.
?
The Overfitting Risk
The productivity surge enabled by AI tools creates a specific danger: more rapid strategy iteration without statistical discipline produces overfit models rather than robust trading edges. Industry experts emphasize that walk-forward testing, out-of-sample validation, and regime analysis are non-negotiable. Researchers should expect 20% to 30% live performance decay versus backtested results even for well-constructed strategies.
Evaluating an AI Trading Strategy
Signal Stability (IC test)
Critical
Out-of-sample validation
Critical
Walk-forward testing
Critical
Regime analysis
High
Slippage/cost modeling
High
Black swan stress testing
High
Model interpretability
Medium
Options and Volatility Strategies
Options trading has become significantly more accessible to retail investors since the zero-commission era began, and in 2026 it represents one of the most versatile toolsets available to non-institutional traders. Rather than simply betting on direction, options allow traders to express views on time, volatility, and probability of a particular outcome, creating strategies that can profit even in sideways markets.
Income Strategies: Covered Calls and Cash-Secured Puts
The covered call strategy, which involves selling call options against stock already held in a portfolio, is perhaps the most widely used options approach among retail traders. In the current environment, with technology stocks like Nvidia having surged 27% in three months and the VIX hovering near 19.5, selling near-term covered calls on overextended momentum names generates premium income and provides partial downside protection.
Cash-secured puts, the mirror image of covered calls, involve selling a put option while holding enough cash to buy the stock if assigned. This strategy lets traders get paid for their willingness to buy a stock at a lower price. After the mid-June chip stock selloff, for example, traders selling cash-secured puts on semiconductor names at support levels could collect elevated premiums in a post-spike implied volatility environment.
Volatility Strategies: Iron Condors and Straddles
Iron condors profit when the underlying asset stays within a defined range through expiration, collecting premium from both a call spread and a put spread. The strategy suits range-bound conditions and works well in periods between major catalysts. Straddles and strangles, by contrast, bet on significant movement in either direction, making them attractive before binary events like Fed announcements, major earnings releases, or geopolitical developments. In 2026, with PCE data, Fed meetings under new Chair Warsh, and ongoing Iran conflict headlines providing regular volatility catalysts, event-driven options strategies have seen elevated profitability for well-positioned traders.
Macro and Sector Rotation Trading
Sector rotation is the practice of shifting portfolio weights between industry sectors based on macroeconomic conditions, interest rate expectations, and the stage of the business cycle. It is one of the most practical and broadly applicable strategies for retail investors who cannot build complex algorithmic systems but can analyze macro trends and position portfolios accordingly.
The current sector leadership in 2026 is being driven by two distinct forces. Energy and materials are benefiting from a genuine supply shock, the Iran conflict that disrupted Strait of Hormuz flows, creating fundamental earnings tailwinds that sector rotation models identify as a sustainable overweight. Technology’s leadership is more complex: AI infrastructure earnings growth has been spectacular, with companies like Nvidia and Micron seeing estimates revised higher by over 50% since December 2024, but the sector’s 27% three-month run has created the kind of crowded positioning that historically precedes sharp corrections. The mid-June chip selloff illustrates that momentum and fundamentals can diverge sharply in short timeframes.
Sector rotation traders are also watching the interest rate backdrop carefully. New Fed Chair Warsh’s hawkish positioning is most damaging to interest-rate-sensitive sectors like real estate and long-duration growth stocks, while benefiting banks and financial institutions that earn wider net interest margins in a higher-for-longer environment. Diversified macro rotation strategies in 2026 look overweight energy, materials, and select financials, while managing technology exposure with defined profit targets and stop levels.
The Alternative Data Edge
Alternative data refers to any data used to generate trading signals that falls outside traditional market data (price and volume) and fundamental data (financial statements, earnings). It has become one of the most actively exploited categories of investment edge in 2026, with institutional managers spending billions annually on data subscriptions, engineering talent, and proprietary collection methods.
The most commonly used alternative data categories include satellite imagery to track oil inventories, shipping activity, and retail parking lot occupancy; credit card transaction data aggregated across millions of consumers to assess company revenues before earnings announcements; job posting data on LinkedIn and Indeed that signals corporate expansion or contraction plans months before public disclosures; web traffic analytics from services like SimilarWeb or Semrush; and social media and news sentiment scraped and processed through NLP models in real time.
For retail traders, the practical implication is not to build satellite imaging networks but to understand that institutional participants are trading with information advantages that price-and-volume analysis alone cannot match. The response is to focus on markets and timeframes where alternative data has less edge, to use available semi-alternative data sources like earnings transcript sentiment tools, options flow analytics, and dark pool data, and to be skeptical of technical setups that contradict emerging fundamental narratives.
Risk Management Frameworks for 2026
Risk management is the variable that separates long-term survival in markets from eventual account destruction. In a 2026 environment characterized by a hawkish new Fed chair, elevated geopolitical risk, crowded AI sector positioning, and historically stretched equity valuations, rigorous risk control is not optional. It is the core competency that allows any trading strategy to survive long enough to collect the returns it theoretically generates.
Position Sizing: The Kelly Criterion and Fixed Fractional
The Kelly Criterion is a mathematical formula that calculates the optimal fraction of capital to risk on a trade based on the edge and payout ratio of the strategy. Full Kelly can produce dramatic drawdowns even for high-edge strategies, so most professional traders use half-Kelly or quarter-Kelly in practice. Fixed fractional position sizing, where a trader never risks more than a defined percentage (commonly 1% to 2%) of total capital on any single trade, is the most widely recommended approach for retail traders for its simplicity and built-in loss limitation.
Stop-Loss Placement and Drawdown Limits
Hard stop-losses define the maximum loss on any individual trade before the position is automatically exited. Volatility-adjusted stops, which widen in high-VIX environments and tighten in low-VIX ones, are more sophisticated and avoid the common problem of being stopped out by normal daily noise only to see the trade work in the original direction after exit. Portfolio-level drawdown limits define the maximum acceptable decline in total capital before the trader reduces position sizes across all strategies, a critical discipline during drawdown periods that psychology alone cannot enforce reliably.
Correlation and Regime Awareness
A portfolio of ten trades that are all highly correlated is not a diversified portfolio: it is a single large bet expressed ten ways. Modern risk management for 2026 requires tracking correlations across positions, recognizing that traditionally uncorrelated assets can snap to high correlation during market stress events, as happened during the February Iran attack when oil, bonds, and equities moved simultaneously in sharp, unexpected ways. Regime detection models that identify whether the current market is trending, mean-reverting, or in crisis mode allow traders to dynamically adjust position sizes and strategy weights accordingly.
Risk no more than 1% to 2% of total capital on any single trade
Use volatility-adjusted stop-losses that adapt to changing market conditions
Set portfolio-level drawdown limits (15% to 20% is a common professional threshold)
Monitor correlation between open positions to avoid hidden concentration
Apply regime detection to adjust strategy weights between trending and range-bound periods
Stress-test every strategy against the 2020 crash, 2022 rate shock, and 2026 Iran spike
Maintain cash reserves to take advantage of volatility-driven opportunity
Never add to a losing position beyond the original planned allocation
Strategy Comparison: What Works in 2026
Strategy
2026 Effectiveness
Ideal Market Regime
Min. Capital
Time Commitment
Risk Level
Energy Sector Trend
Very High
Geopolitical Supply Shock
$5,000
Weekly review
Moderate
AI/Tech Momentum
Caution
Bull / AI Narrative
$5,000
Daily monitoring
High
Covered Call Income
High
High implied volatility
$10,000+
Weekly setup
Low-Mod
Macro Sector Rotation
High
Regime transitions
$10,000
Monthly review
Moderate
Mean Reversion (Pairs)
Moderate
Range-bound / Post-spike
$25,000
Daily active
Moderate
ML Sentiment Trading
High (Institutional)
News-driven markets
$50,000+
Continuous
High
Iron Condor (Options)
Moderate
Between catalysts
$15,000
Event-driven
Moderate
Buy-and-Hold S&P 500
High
Long-term bull market
$500
Minimal
Low
Essential Tools and Platforms for Modern Traders
The technology stack available to individual traders in 2026 is genuinely impressive. A decade ago, the data, compute, and connectivity required for quantitative trading were institutionally exclusive. Today, a well-equipped retail trader can access backtesting engines, live data feeds, options analytics, and AI-powered signal tools for a few hundred dollars a month or less.
Retail Trader Technology Adoption by Category (2026 Survey Estimate)
Core Platform Categories
Charting and technical analysis platforms led by TradingView remain the most universally adopted tool, providing real-time data, custom indicators, Pine Script strategy coding, and community-shared ideas. For backtesting, QuantConnect offers institutional-grade capabilities through a cloud-based platform with Python support and live trading integration. For options-focused traders, tools like Tastytrade, thinkorswim, and IBKR’s OptionTrader provide the analytics needed for Greeks management, probability calculations, and strategy visualization.
For AI-augmented trading, platforms from established brokers now embed algorithmic execution, automated alerts based on ML signals, and sentiment dashboards. No-code platforms like TradersPost and TradeRiser AI allow traders without programming backgrounds to automate strategy execution through TradingView signal integration, significantly lowering the technical barrier to systematic trading.
The Retail Trader Advantage in 2026
The common assumption is that retail traders are always at a disadvantage relative to institutions. This is true in some domains, particularly execution speed, data access, and capital scale, but it misses several genuine structural advantages that individual traders possess and that institutions cannot exploit.
The first advantage is capacity. Institutional funds managing billions of dollars cannot take meaningful positions in small-cap stocks or illiquid instruments without moving the market against themselves. A retail trader with a $50,000 account can access high-edge opportunities in smaller markets where institutional money cannot follow. The second advantage is flexibility. A hedge fund cannot change its stated strategy without notifying investors and potentially triggering redemptions. A retail trader can shift between strategies instantly as market conditions change, for example exiting AI momentum in mid-June and rotating into energy the same day, with no compliance review or investor committee approval required.
The third advantage is the absence of benchmark pressure. Institutional portfolio managers are evaluated against benchmarks quarterly and face job risk for underperforming for two consecutive quarters. This forces them into crowded consensus positions and prevents them from holding cash during overvalued markets. A retail trader with a longer time horizon and no career risk can exercise genuine patience, waiting for high-conviction setups rather than being compelled to deploy capital continuously.
How to Backtest and Validate a Strategy
Backtesting is the process of simulating how a trading strategy would have performed on historical data. It is an essential step before risking any real capital on a systematic approach, but it is also one of the most commonly misapplied tools in retail trading. The central risk is overfitting: creating a strategy that fits historical data perfectly but has no predictive value because its parameters were implicitly tuned to known outcomes.
The Scientific Workflow
Professional quantitative researchers begin with an idea grounded in economic logic or academic research rather than in data mining. They then test whether the underlying signal has predictive power using information correlation analysis before writing any strategy code. Only if the signal demonstrates statistical stability does the researcher proceed to implement the strategy with predefined rules, test it on out-of-sample data, apply walk-forward optimization, and then validate through live paper trading before committing real capital.
A rigorous backtest should use point-in-time data that reflects what was actually known at each historical timestamp, eliminating look-ahead bias. It should model realistic transaction costs including commissions, bid-ask spreads, and slippage. It should test across multiple market regimes, including at minimum the 2020 COVID crash, the 2022 rate shock, and the 2026 Iran supply spike. And it should apply Monte Carlo simulation to assess the range of possible outcomes beyond the single historical path.
Research using four years of out-of-sample testing from 2022 to 2026 found that unrestricted machine learning models were mathematically indistinguishable from random noise at the 10% significance level when tested for statistical significance, while Graham-style value-constrained models produced statistically significant alpha with lower drawdowns. The practical lesson for 2026 traders: complexity does not automatically confer edge. Fundamental constraints and disciplined model design consistently outperform brute-force optimization in out-of-sample conditions.
Backtest Checklist
Use only out-of-sample data for final evaluation. Model at least 1 to 2 ticks of slippage on futures. Include commission costs at realistic rates. Test across 2020, 2022, and 2026 stress periods. Apply walk-forward optimization with at least 30% of data held out. Run Monte Carlo simulation on the equity curve. Expect 20% to 30% performance decay in live trading versus the best backtest scenario.
Frequently Asked Questions
What is the best trading strategy for 2026?
There is no single best strategy because effectiveness depends on market regime, time horizon, and capital size. In mid-2026, macro-driven sector rotation into energy and materials has been the top-performing approach, given the Iran supply shock. For longer-term investors, a systematic momentum strategy on S&P 500 sectors, combined with covered call writing on overextended positions, has offered strong risk-adjusted returns. The most important factor is matching the strategy to the current market regime, not finding the single highest-returning approach.
How much of trading volume is controlled by algorithms in 2026?
AI and algorithmic systems now power an estimated 89% of global trading volume. In U.S. equities and futures specifically, a substantial majority of order flow is computer-generated, and high-frequency trading accounts for 60% to 70% of U.S. stock trades alone. This does not mean retail traders cannot succeed, but it does mean that competing on pure execution speed against institutional algorithms is futile, and that retail strategies should focus on edges where time horizon, flexibility, and small position sizes provide structural advantages.
How does the Federal Reserve impact trading strategies in 2026?
The Federal Reserve is the single most important macro driver for most asset classes. New Chair Kevin Warsh’s hawkish stance and abstention from submitting a rate forecast have introduced significant uncertainty about the path of rates. In practice, this affects trading in three ways: it sustains higher Treasury yields (currently 4.48%) that compress growth stock valuations; it benefits financial sector earnings through wider net interest margins; and it makes volatility-driven options strategies more attractive given elevated VIX levels. Traders should stay highly alert to any shifts in Fed communication and adjust duration and sector exposure accordingly.
Can retail traders effectively use AI trading tools?
Yes, with appropriate realistic expectations. Retail-accessible AI tools in 2026 include no-code strategy builders, backtesting platforms with ML integration, sentiment analysis dashboards, and automated execution through broker APIs. These tools genuinely lower the barrier to systematic trading. However, the same tools are widely available, which means any edge they generate is competed away more quickly than proprietary institutional strategies. The most effective retail use of AI is in research assistance, signal filtering, and disciplined backtesting rather than expecting AI to generate alpha automatically.
What are the biggest market risks for U.S. traders in the second half of 2026?
The five primary risk factors for U.S. traders in H2 2026 are: (1) a potential Fed rate hike if inflation remains above target, which would pressure equity valuations significantly; (2) an escalation of the Iran conflict that sends oil prices higher, stokes inflation, and forces the Fed’s hand; (3) a sharper-than-expected technology sector correction after the 27% three-month run in AI and semiconductor names; (4) new tariffs from the Trump administration following the expiration of the 10% global tariff in late July; and (5) unexpected deterioration in consumer spending or labor markets that shifts the market’s growth narrative.
What is the minimum capital needed to start algorithmic trading?
The practical minimum depends heavily on the strategy. For basic trend-following ETF strategies using a standard brokerage account, $5,000 is a meaningful starting point. For options strategies requiring defined margin, $10,000 to $25,000 is more practical. For pairs trading or stat arb that requires pattern day trader status (which requires $25,000 in equity for U.S. margin accounts), that regulatory minimum applies. Genuinely sophisticated algorithmic systems with multiple concurrent positions and dynamic risk management benefit from $50,000 or more to provide meaningful diversification and absorb normal drawdowns without breaching risk limits.
Final Strategy Playbook for H2 2026
The second half of 2026 will reward traders who combine macro awareness with systematic discipline and rigorous risk management. Three forces will dominate: the trajectory of Fed policy under Kevin Warsh, the duration and severity of the Iran energy supply shock, and the sustainability of AI infrastructure earnings growth in the face of increasingly expensive valuations.
The most effective strategic posture combines sector rotation exposure to energy and materials for macro alignment, selective AI-sector participation with defined exit levels given crowded positioning, covered call writing on overextended growth names to capture elevated implied volatility, and options event strategies around Fed meetings and quarterly earnings for the highest-probability catalyst plays.
Top Macro Trade
Long Energy, Short Duration
Best Income Strategy
Covered Calls on Tech
Key Risk to Watch
Warsh Fed Rate Hike Signal
S&P 500 Year-End Target
7,850 (Median Wall St.)
AI Market Size (2026)
$27.85 Billion
Algo Share of Volume
89% Global
Disclaimer: This article is for educational and informational purposes only and does not constitute financial, investment, tax, or legal advice. Trading involves substantial risk of loss. Past performance of any strategy or market condition discussed is not indicative of future results. Always conduct your own research and consult a qualified financial professional before making any investment decisions. The author does not hold positions in any specific securities mentioned.