How to Use Economic Indicators to Make Better Investment Decisions (2026 Guide)
Article Summary
Economic indicators are the scoreboard of the economy and investors who can read that scoreboard make smarter, more confident portfolio decisions. This guide covers the major leading, coincident, and lagging indicators that matter most: GDP growth, the Consumer Price Index (CPI), unemployment rate, Federal Reserve interest rates, the Conference Board Leading Economic Index (LEI), the yield curve, PMI, consumer confidence, and more.
As of mid-2026, the U.S. economy is expanding at roughly 1.6% GDP annually, inflation remains sticky above 3%, the Fed is holding its benchmark rate at 3.50%–3.75%, and an AI-driven investment boom is creating a two-speed market. This guide shows you exactly how to translate those numbers into actionable investment strategy.
You will learn how each indicator works, how to find it for free, what it signals for stocks, bonds, real estate, and commodities, and how to combine multiple indicators into a coherent investment framework, without needing a finance degree.
1. What Are Economic Indicators?
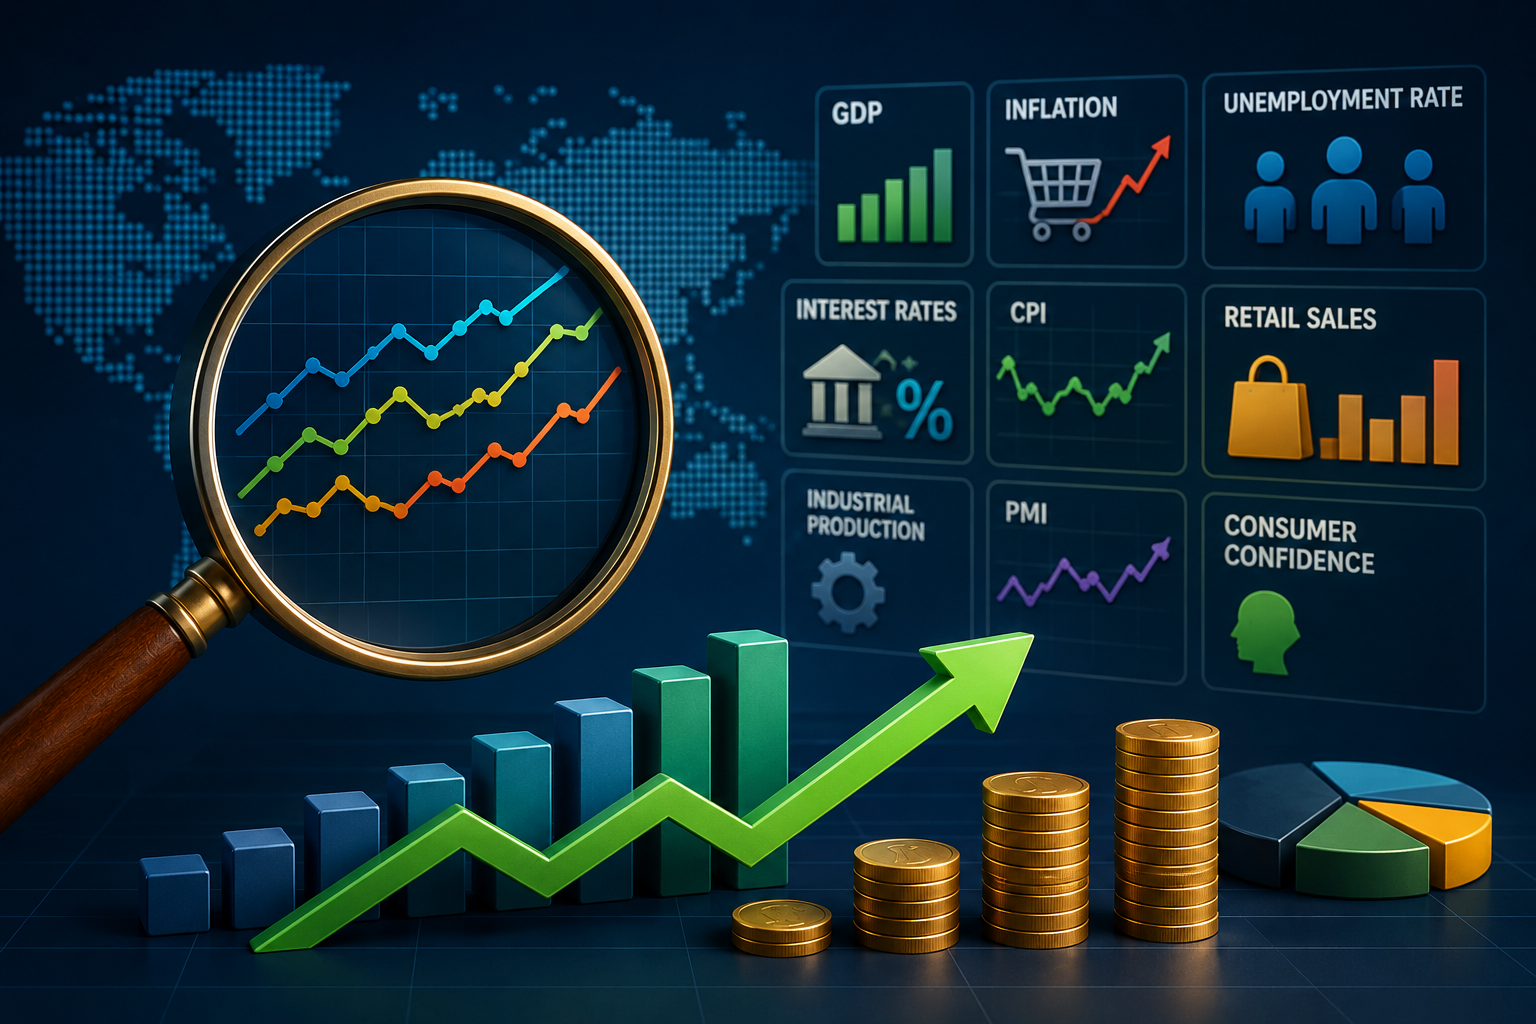
Economic indicators are statistics that describe the current state, direction, and health of an economy. Governments, central banks, universities, and research organizations publish hundreds of them. For investors, the goal is not to read all of them — it is to identify which ones move markets and then act ahead of the consensus.
Indicators are classified into three categories based on their timing relative to the overall business cycle:
Category
Definition
Key Examples
Investment Use
Leading
Change before the economy turns; used for forecasting
Conference Board LEI, yield curve, new building permits, ISM new orders
Highest value Anticipate market shifts 6–12 months ahead
Change after the economy has turned; confirm trends
Unemployment rate, CPI, prime rate, corporate debt levels
Supporting Confirm a trend is real, not noise
The classic mistake investors make is treating lagging indicators as predictive. Unemployment, for example, typically peaks after a recession has already bottomed. By the time unemployment is making headlines, the stock market recovery is often already well underway. This is why understanding the type of indicator is just as important as the reading itself.
2. 2026 Economic Snapshot: The Numbers Right Now
Before diving into each indicator, here is a real-time snapshot of the key economic metrics shaping U.S. investment decisions as of June 2026. All data is sourced from the Federal Reserve, BEA, Conference Board, and the Bureau of Labor Statistics.
1.6%
+1.1pp vs Q4 2025
U.S. GDP growth Q1 2026 (annualized)
4.2%
Above 2% target
CPI Inflation, May 2026 (year-over-year)
3.75%
Hold since Sept 2025
Fed Funds Rate (upper bound)
4.3%
Stable
Unemployment Rate, May 2026
99.3
+0.1 MoM
Conference Board LEI, May 2026
3.2%
Still elevated
Core PCE Inflation (ex food & energy)
Breaking: June 2026
New Fed Chair Kevin Warsh Signals “Higher for Longer”
At the June 17, 2026 FOMC meeting, new Federal Reserve Chair Kevin Warsh kept the benchmark rate at 3.50%–3.75% and signaled the committee is “unanimous and unambiguous” in its commitment to fighting inflation. Warsh mentioned “price stability” 12 times at his inaugural press conference. Markets now price in a potential rate hike by October 2026, a dramatic reversal from earlier expectations of rate cuts.
This single leadership shift fundamentally changes the investment calculus for bond investors, rate-sensitive growth stocks, and real estate investment trusts (REITs) for the remainder of 2026.
3. GDP: The Economy’s Report Card
Gross Domestic Product (GDP) is the total monetary value of all goods and services produced in a country over a specific period. It is the broadest measure of economic activity, and understanding its trends is foundational for any investor.
How GDP Growth Maps to Investment Returns
Strong GDP growth (above 2.5% annualized) typically signals healthy corporate earnings, low default risk, and rising consumer spending — all of which are favorable for equities. Weak or negative GDP growth signals the opposite. However, the market’s reaction to GDP is more nuanced than simple “up means buy” logic.
U.S. GDP Growth Rate vs. S&P 500 Annual Returns
Illustrative relationship across economic cycles — nominal values
Note that in 2022, GDP growth was positive but the S&P 500 fell roughly 18%. Why? The market anticipated that the Fed’s aggressive rate hikes would crush future earnings. Markets price in expectations, not current reality. This is the single most important concept for any investor using economic data.
What GDP Growth Means for Your Portfolio
GDP Scenario
Stocks
Bonds
Real Estate
Commodities
Above 3% (Expansion)
Bullish Cyclicals, small caps
Bearish Rising yields
Bullish
Bullish Demand-driven
1%–3% (Moderate)
Mixed Quality growth
Neutral
Neutral
Neutral
Below 1% or Negative
Bearish Defensives outperform
Bullish Flight to safety
Bearish
Bearish
Where to find it: The Bureau of Economic Analysis (bea.gov) publishes GDP estimates quarterly, with an “advance” estimate 30 days after each quarter ends, then a “second estimate” 60 days later, and a “final” estimate at 90 days.
4. Inflation (CPI & PCE): The Silent Portfolio Killer
?
Consumer Price Index (CPI) & PCE Deflator
Published by: Bureau of Labor Statistics (CPI) & BEA (PCE) — Monthly
Inflation measures how quickly the purchasing power of money is declining. Two primary gauges exist: the CPI (tracks prices of a basket of consumer goods including shelter, energy, and food) and the PCE Price Index (the Fed’s preferred measure, which adjusts for consumer substitution behavior).
As of May 2026, CPI is running at 4.2% year-over-year, driven largely by energy prices linked to Middle East tensions. Core CPI (excluding food and energy) rose 2.9%, while Core PCE sits at 3.2%, well above the Fed’s 2% long-run target.
Inflation Level
Signal for Stocks
Signal for Bonds
Fed Response
Below 2% (Deflationary risk)
Mixed — growth fears
Bullish (falling yields)
Rate cuts likely
2%–3% (Target range)
Positive — Goldilocks
Neutral to positive
Steady / gradual
3%–5% (Elevated)
Negative for growth, positive for value/energy
Bearish (rising yields)
Hold or hike
Above 5% (High inflation)
Volatile — real assets outperform
Sharply bearish
Aggressive hikes
“Tariff pass-through has added roughly 0.8 percentage points to consumer price inflation in the U.S. Financial markets remain unsettled as supply shocks, fiscal pressures, and uneven policy paths reshape expectations around interest rates and capital flows.”
EY Global Economic Outlook, June 2026
For investors, there are two dimensions to inflation: the level and the direction. Inflation that is high but falling is actually bullish for risk assets because the market anticipates that the Fed will eventually ease policy. Inflation that is low but rising is more dangerous — it catches the market off guard.
Inflation-Resistant Investment Categories
Treasury Inflation-Protected Securities (TIPS): Principal adjusts with CPI; good core holding when real yields are positive.
Commodities (oil, gold, agricultural): Often perform well as inflation rises because they are components of CPI itself. In Q1 2026, commodities returned +24.4%, their best quarterly performance in years.
Energy stocks: Direct beneficiaries when oil prices drive headline CPI higher, as is the case in 2026 due to Middle East supply disruptions.
Real estate (direct ownership): Rents and property values tend to rise with inflation, though REITs (interest-rate sensitive) can underperform when rates are rising to fight inflation.
Value stocks and dividend payers: Companies with pricing power — the ability to pass higher input costs to customers — preserve margins better in inflationary environments.
5. Federal Reserve Interest Rates: The Market’s Gravity
No single indicator influences asset prices more directly than the Federal Reserve’s benchmark federal funds rate. The rate determines the cost of borrowing for everything from 30-year mortgages to corporate revolving credit lines, and it anchors the discount rate that investors use to value every future cash flow from every investment.
Federal Funds Rate — Historical Path & 2026 Outlook
Percent — Federal Reserve / Advisor Perspectives, June 2026
The Rate-Investment Relationship Explained
Interest rates affect every asset class through two primary channels:
1. The discount rate channel: Every stock, bond, or piece of real estate is valued by discounting future cash flows back to the present. When rates rise, the discount rate rises, and the present value of future cash flows falls. Growth stocks — whose value is concentrated far into the future — are hit hardest. This is why high-duration growth stocks like technology shares fell sharply in 2022 even as the economy remained healthy.
2. The borrowing cost channel: Higher rates increase the cost of mortgages, auto loans, corporate debt, and margin borrowing. This slows investment, weakens housing, reduces consumer spending, and squeezes profit margins for heavily leveraged companies.
2026 Fed Update
Markets Now Pricing a Rate Hike by October 2026
In a dramatic reversal from earlier 2026 expectations of rate cuts, markets as of June 2026 are now pricing a 25-basis-point rate hike by the October FOMC meeting. This shift was triggered by the Iran conflict’s effect on global energy prices, which pushed CPI to 4.2% and Core PCE to 3.2%. New Fed Chair Kevin Warsh has explicitly removed forward guidance and emphasized price stability over economic support, raising the possibility of tightening even as growth moderates.
For investors: shorter-duration bonds, floating-rate instruments, and sectors with real pricing power become more attractive. Long-duration Treasuries and rate-sensitive REITs face continued headwinds.
6. Unemployment Rate: Jobs, Spending, and Cycles
?
Unemployment Rate / Nonfarm Payrolls
Published by: Bureau of Labor Statistics — First Friday of Each Month
The unemployment rate measures the percentage of the labor force actively seeking work but unable to find it. It is a lagging indicator — it rises after a recession begins and falls after a recovery is well underway. The nonfarm payrolls report, released simultaneously, shows how many jobs were added or lost in the prior month and is often the single most market-moving monthly data release.
As of May 2026, the U.S. unemployment rate stands at 4.3%, stable over the past year. Private employers added an average of 117,000 jobs per month through May 2026, compared to just 10,000 per month in all of 2025. This stabilization removes pressure on the Fed to cut rates and instead allows policymakers to focus on inflation.
Unemployment Trend
Economic Phase
Stock Market Signal
Bond Signal
Falling rapidly
Mid-to-late expansion
Bullish but watch for overheating
Bearish (Fed may hike)
Low and stable (3.5%–4.5%)
Full employment
Moderate — quality over quantity
Neutral
Rising slowly
Early recession or late cycle
Defensives, utilities, healthcare
Bullish (rate cuts coming)
Rising sharply above 6%
Recession
Bearish / bear market
Very bullish (safe haven)
One nuanced concept often missed by retail investors is the distinction between the headline unemployment rate and what the BLS calls the U-6 rate, which includes part-time workers who want full-time work and marginally attached workers who have given up searching. The U-6 can be significantly higher than the headline figure and provides a more complete picture of labor market slack.
7. The Leading Economic Index: Predicting Turns Before They Happen
?
Conference Board Leading Economic Index
Published by: The Conference Board — Monthly
The Conference Board’s Leading Economic Index (LEI) is a composite of 10 forward-looking components including stock prices, building permits, manufacturing new orders, consumer expectations, the yield spread, and average weekly hours in manufacturing. Its value lies not in any single month’s reading but in its six-month change rate, which historically has anticipated recessions 6–12 months in advance.
In May 2026, the LEI rose 0.1% to 99.3, its second consecutive small monthly gain. However, the six-month growth rate remains negative at -0.3%, suggesting slower economic expansion ahead. Consumer expectations remain a major drag, while stock prices and interest rate spreads are providing the only positive contributions.
LEI Signal
Interpretation
Historical Accuracy
Six-month change above +1%
Economic expansion likely; risk-on
Strong (3+ consecutive months needed)
Six-month change near zero
Slowdown / transition; quality bias
Moderate — watch direction
Six-month change below -1%
Recession risk elevated; defensives
Strong recession predictor historically
Three or more consecutive monthly declines
Historical recession warning signal
Has preceded every U.S. recession since 1960
8. The Yield Curve: Bonds Know Before Everyone Else
The yield curve is a graph that plots the interest rates of U.S. Treasury bonds across different maturities — from 3-month bills to 30-year bonds. In a healthy economy, longer-term bonds pay more than short-term ones (an upward slope), compensating investors for the additional risk of locking up money longer. When the curve inverts — when short-term yields exceed long-term yields — it has preceded every U.S. recession since 1955 with remarkable reliability.
Treasury Yield Curve: Normal vs. Inverted vs. 2026
Illustrative yield curves across economic environments
The 2022–2023 inversion (when 2-year yields rose well above 10-year yields) correctly warned of economic stress. By 2026, the curve has largely normalized, but the Fed’s potential hawkish pivot is creating fresh concerns about the long end of the curve, particularly given rising sovereign debt levels and geopolitical risk premiums.
The key spread to watch is the 2-year vs. 10-year Treasury spread. When the 10-year yield is higher than the 2-year by more than 0.5 percentage points, the curve is “steep” and typically signals economic optimism. When they are close or inverted, caution is warranted.
9. PMI: The Pulse of Business Activity
?
Purchasing Managers’ Index (PMI)
Published by: ISM (Manufacturing & Services) — First and Third Business Day Each Month
The PMI is a monthly survey of purchasing managers at hundreds of companies. It aggregates information about new orders, inventory levels, production, supplier deliveries, and employment into a single index. The magic number is 50: readings above 50 indicate expansion; below 50 indicate contraction.
The PMI is one of the most market-sensitive releases of each month because it is both timely (published at the start of the month for the prior month) and forward-looking (new orders component predicts production activity 3–6 months ahead).
PMI Reading
Signal
Sector Implications
Above 55
Strong expansion — bullish industrials
Buy: materials, industrials, energy
50–55
Modest growth — selective
Favor quality growth names
45–50
Mild contraction — caution
Rotate to defensives, consumer staples
Below 45
Significant contraction — bear signal
Bonds, gold, utilities, cash
The ISM Manufacturing PMI and ISM Services PMI are the two most widely watched versions in the United States. Since the services sector accounts for roughly 80% of U.S. GDP, the services PMI often carries more weight for overall economic assessment.
10. Consumer Confidence and Retail Sales
Consumer spending accounts for approximately 70% of U.S. GDP. When consumers feel confident about their jobs and financial futures, they spend freely, which drives corporate revenue, hiring, and investment. When confidence craters, spending falls first — often before any official statistics confirm the downturn.
CURRENT CONSUMER SENTIMENT SIGNALS — June 2026
University of Michigan
Weak
Conference Board CC
Below avg
Consumer Spending
Moderate
Retail Sales MoM
Stable
PCE Growth YoY
Decent
One of the most striking features of the 2026 economy is the disconnect between sentiment and spending. Consumer sentiment as measured by the University of Michigan is near historic lows, yet actual consumer spending (PCE) grew 0.5% in April alone. The explanation, according to Deloitte and the Conference Board, is a wealth effect: AI-driven equity market gains have boosted the net worth of wealthier households, sustaining their spending even as lower-income households face a severe squeeze from elevated energy prices and grocery costs.
This divergence points to a K-shaped economy — a theme JPMorgan Research has highlighted prominently as one of the defining features of 2026 markets. Higher-income consumers and AI-adjacent workers are thriving; lower-income households are pulling back sharply on discretionary spending. Investors should favor companies with exposure to affluent consumers or automation-driven productivity gains, and be cautious on lower-end consumer discretionary names.
11. Asset Class Playbook: What Each Indicator Signals
Here is a consolidated matrix showing how each key indicator should inform your thinking about different asset classes.
Indicator
U.S. Stocks
Bonds / Fixed Income
Real Estate (REITs)
Gold & Commodities
International
Rising GDP
Bullish
Bearish
Bullish
Neutral
Bullish
Rising Inflation (3%+)
Value over Growth
Bearish
Mixed
Bullish
Mixed
Fed Rate Hike
Growth hit
Bearish
Bearish
Short-term bearish
USD strength
Fed Rate Cut
Bullish
Bullish
Bullish
Bullish
EM benefit
Rising Unemployment
Bearish / Defensives
Bullish
Bearish
Safe haven
Risk-off
Inverted Yield Curve
Caution: 12-18 months
Bullish (long-term)
Caution
Safe haven demand
Selective
PMI above 55
Industrials / Materials
Modest pressure
Bullish
Demand-driven
Bullish
Low Consumer Confidence
Discretionary hit
Safety demand
Bearish
Neutral
Risk-off
12. 2026 Investment Strategy Using Current Indicators
Let us now synthesize the current data into a coherent investment framework for the second half of 2026. This is not personalized financial advice — it is an illustration of how a disciplined investor would read the current indicator mosaic.
2026 Indicator Mosaic
What the Data Is Telling Us Right Now
GDP growing at 1.6% (slower but positive). CPI at 4.2% (sticky, energy-driven). Core PCE at 3.2% (well above target). Fed holding at 3.50%–3.75% with possible hike. Unemployment stable at 4.3%. LEI barely positive. Consumer sentiment weak but spending holding. AI capital expenditure surging. Commodities up 24% in Q1. Oil at roughly $76/barrel after spiking to $113 in April.
The 2026 Market Context
Several major sources — Morgan Stanley, JPMorgan, BlackRock, Charles Schwab, and Fidelity — share a broadly similar read: the U.S. economy is in a slow-growth, sticky-inflation environment that is being bifurcated by an AI investment supercycle. Morgan Stanley’s S&P 500 target for mid-2027 stands at 8,300, supported by expected earnings growth of 23% in 2026 and 12% in 2027, largely driven by AI-adjacent companies.
Asset Category
2H 2026 Signal
Reasoning
Key Risks
U.S. Equities (AI/Tech)
Constructive
AI CapEx driving 13%–15% earnings growth; hyperscaler spending sustained
Concentration risk; high valuations; rate hike shock
Energy Stocks
Bullish
Oil supply disruption + sticky energy inflation = pricing power
Ceasefire / supply normalization could reverse quickly
Commodities (broad)
Overweight
Real asset demand + inflation hedge + geopolitical premium
Dollar strength; demand slowdown if recession risk rises
Long-Duration Treasury Bonds
Underweight
Possible rate hike + fiscal deficit + rising term premiums
Surprise recession would cause rapid bond rally (wrong side)
Investment Grade Corporate Bonds
Selective
Spreads tight but income attractive; prefer shorter duration
Spread widening if growth slows more than expected
Eurozone earnings growing 13%+; Japanese corporate reforms positive
Weaker global growth; USD strength headwind
Gold
Bullish
Geopolitical uncertainty + central bank buying; JPMorgan target $5,000/oz
Rising real yields would be headwind
Consumer Discretionary (low-end)
Underweight
Lower-income consumers squeezed; K-shaped economy penalizes mass market
Wage growth acceleration could reverse
Defensives (Healthcare, Utilities, Staples)
Hold / Accumulate
Portfolio ballast; benefit if economic growth disappoints
Underperform in strong growth scenario
The AI Supercycle as an Economic Indicator Signal
One of the most striking features of the 2026 investment landscape is that AI capital expenditure has itself become a leading economic indicator. When hyperscalers (Amazon, Microsoft, Google, Meta) announce large CapEx plans, it triggers a cascade of secondary spending on energy infrastructure, semiconductors, fiber optics, and data center construction. JPMorgan identifies this as a “record level of CapEx” that is driving above-trend earnings growth for U.S. equities. BlackRock describes it as a “mega force” that creates both structural opportunity and concentrated risk.
“AI isn’t just a tech story anymore. It’s spreading into banks, healthcare, logistics, and utilities. For investors, this is the anchor theme driving our bullish outlook on U.S. stocks.”
JPMorgan Global Research 2026 Market Outlook
13. Common Mistakes When Using Economic Indicators
Understanding what economic indicators say is only half the battle. Knowing how not to misuse them is equally important.
Mistake 1: Acting on the Data Release, Not the Revision to Expectations
Markets do not react to economic data in isolation — they react to data relative to expectations. A GDP report of 2.5% is bullish if forecasters expected 1.5%, but bearish if they expected 3.5%. Always compare the release to the Bloomberg consensus estimate, not to last quarter’s reading.
Mistake 2: Using Lagging Indicators as Leading Ones
Many investors buy stocks when unemployment is low and sell when it rises. But by the time unemployment rises meaningfully, the stock market has usually already priced in the recession. The correct move is to monitor leading indicators (LEI, yield curve, PMI new orders) and use lagging indicators only to confirm a thesis, not initiate one.
Mistake 3: Over-Weighting Any Single Indicator
No single indicator has a perfect track record. Even the inverted yield curve — the most reliable recession signal in history — produced a long lag between the 2022–2023 inversion and any actual recession materializing. Experienced investors use a mosaic approach, looking for confirmation across multiple indicators before making large portfolio shifts.
Mistake 4: Ignoring the Fed’s Reaction Function
In the current environment, many investors are asking: “Is the economy strong?” The better question is: “How will the Fed respond to this economic data, and how will that response affect asset prices?” Strong jobs data in 2026 is not purely bullish — it removes the Fed’s incentive to cut rates, which keeps pressure on rate-sensitive assets and supports the dollar.
Mistake 5: Forgetting That Markets Are Forward-Looking
By the time a recession is officially declared (which the NBER does months after it begins), the stock market has typically already sold off 30–40% and begun its recovery. The famous Wall Street saying is that the market has “predicted nine of the last five recessions.” The indicator tells you about the economy — your job as an investor is to figure out what the market has already priced in.
14. Investor Action Checklist
Monthly Economic Indicator Review Checklist for U.S. Investors
Check the Conference Board LEI release (published ~3rd week of each month) — note 6-month trend direction
Review the BLS Jobs Report (first Friday of each month) — compare payrolls to consensus; note unemployment direction
Track the CPI release (~12th of each month) — focus on Core CPI and whether the trend is improving or worsening vs. the Fed’s 2% target
Monitor the ISM Manufacturing PMI (1st business day) and ISM Services PMI (3rd business day) — track whether above or below 50
Read the FOMC statement and chair press conference after each Fed meeting (8 times per year)
Watch the 2yr / 10yr Treasury spread at least once per month — flag any significant narrowing or inversion
Review BEA GDP advance estimate quarterly — compare to the prior Fed projection in the SEP
Note commodity prices (oil, gold) monthly as real-time inflation and geopolitical risk signals
Read one institutional economic outlook quarterly (Fidelity, Schwab, JPMorgan, or BlackRock are freely available)
Reassess your portfolio positioning relative to the current cycle phase: expansion, slowdown, recession, or recovery
Where to Find All of This for Free
Indicator
Free Source
Frequency
GDP
bea.gov
Quarterly (3 estimates)
CPI & Core CPI
bls.gov
Monthly (~12th)
PCE / Core PCE
bea.gov
Monthly (last business day)
Nonfarm Payrolls / Unemployment
bls.gov
Monthly (first Friday)
Fed Funds Rate / FOMC
federalreserve.gov
8 meetings/year
Conference Board LEI
conference-board.org
Monthly (~3rd week)
ISM PMI
ismworld.org
Monthly (1st and 3rd business day)
Yield Curve Data
federalreserve.gov/releases/h15
Daily
Consumer Confidence
conference-board.org
Monthly (last Tuesday)
University of Michigan Sentiment
lsa.umich.edu/sca
Monthly (preliminary mid-month)
15. Frequently Asked Questions
Which economic indicator is the most important for stock market investors?
If forced to choose one, most professional investors point to the Federal Reserve’s interest rate policy and its outlook — because it directly determines the discount rate applied to all stock valuations. But the most reliable framework uses a combination of the Conference Board LEI (for directional bias), the yield curve (for recession risk), CPI (for policy expectations), and PMI (for sector rotation timing).
Can you predict a recession using economic indicators?
No indicator predicts recessions with certainty, but certain combinations dramatically improve odds. The most historically reliable signal is three or more consecutive monthly declines in the Conference Board LEI combined with an inverted yield curve. Both signals appeared in 2022–2023, and while the anticipated recession was mild and arguably avoided, they correctly identified a significant economic slowdown and a bear market in equities.
How do I use economic indicators if I am a long-term buy-and-hold investor?
For long-term investors with a 10+ year horizon, economic indicators matter most for two decisions: (1) deciding on your strategic asset allocation (how much in stocks vs. bonds), and (2) opportunistic rebalancing during significant cycle turns. You do not need to trade on every indicator — but understanding where you are in the economic cycle helps you avoid behavioral mistakes like selling at the bottom of a recession or overconcentrating in a single sector at the top.
What is the difference between the CPI and the PCE, and which should investors care more about?
The CPI (Consumer Price Index) measures price changes for a fixed basket of goods and receives the most media coverage. The PCE (Personal Consumption Expenditures) deflator is the Fed’s preferred measure because it adjusts for consumer substitution (when people switch to cheaper alternatives) and covers a broader range of spending. For investors monitoring Fed policy, Core PCE is the number that matters most, because it is what the Fed explicitly targets in its 2% inflation goal.
How long does it take for a Fed rate hike to affect the economy?
The Fed’s own research suggests that monetary policy operates with “long and variable lags” of 12 to 24 months. This means that rate hikes made in 2022 and 2023 were still working their way through the economy in 2025 and into 2026. This lag is why investors need to think several quarters ahead when positioning for a rate cycle change, not just react to the day’s decision.
What does the 2026 “K-shaped economy” mean for my investments?
The K-shaped economy describes an environment where upper-income households and AI-adjacent workers are thriving while lower-income households face deteriorating financial conditions from inflation and stagnant wages. For investors, this favors companies serving affluent consumers, businesses with AI productivity advantages, and premium-priced goods and services over mass-market discretionary products. It also means aggregate data (like headline consumer spending) can be misleading if it masks the sharp divide between income cohorts.
Key Economic Milestones: 2025–2026
Sept–Dec 2025
Fed delivers three consecutive 25bp rate cuts, bringing fed funds rate to 3.50%–3.75%. Markets price in two further cuts in 2026.
Jan–Feb 2026
Iran conflict escalates; Strait of Hormuz effectively closes. Oil spikes from $57/barrel to a peak of $113 in April. CPI begins rising sharply.
Q1 2026
U.S. GDP grows at 1.6% annualized, recovering from 0.5% in Q4 2025. Commodities surge 24.4%. Earnings growth remains strong, concentrated in AI-exposed sectors.
April 29, 2026
Jerome Powell’s likely final FOMC meeting as chair. Fed holds at 3.50%–3.75% amid four dissents. Core PCE reaches 3.3%. Markets begin pricing potential rate hikes.
May 2026
Kevin Warsh becomes new Federal Reserve Chair. Senate Banking Committee confirms. May CPI rises 4.2% year-over-year. Conference Board LEI posts second consecutive small gain.
June 17, 2026
Warsh’s first FOMC meeting: holds rates steady; removes forward guidance; says committee is “unanimous and unambiguous” on price stability. Markets price in an October hike.
H2 2026 (Outlook)
Fed expected to remain on hold or hike once. Inflation path depends heavily on energy prices and Middle East de-escalation. AI CapEx continues. Morgan Stanley targets S&P 500 at 8,300 by mid-2027.
Putting It All Together
Economic indicators are not crystal balls. They are imperfect, backward-looking (even the “leading” ones have lag), and subject to revision. What makes them powerful is not any individual reading but the pattern — the mosaic formed when GDP, inflation, employment, Fed policy, the yield curve, and business activity surveys are all pointing in the same direction.
In mid-2026, that mosaic tells a specific story: slow but positive growth, sticky inflation above the Fed’s target, a central bank that is pivoting hawkish under new leadership, an AI-driven investment boom that is concentrating market returns in a narrow group of companies, and consumers who are spending more than their sentiment suggests they should. That story favors energy, commodities, AI infrastructure, quality corporate bonds, and gold — and argues for caution on long-duration bonds, rate-sensitive REITs, and lower-end consumer discretionary.
The most important discipline in investing with economic indicators is patience. It takes months, sometimes years, for economic signals to fully translate into market returns. Investors who understand this — who build their portfolio around the economic cycle rather than reacting to headlines — consistently outperform those who try to trade every data release.
Track the indicators. Read the mosaic. Stay diversified. And revisit your framework every quarter as the data changes.
Key Takeaways from This Article
Economic indicators fall into leading, coincident, and lagging categories — understanding the type matters as much as the reading
Markets price in expectations, not current data — always compare releases to consensus forecasts, not to prior periods
As of June 2026: GDP +1.6%, CPI +4.2%, Core PCE +3.2%, Fed rate 3.50–3.75%, unemployment 4.3%
The Fed under new Chair Kevin Warsh is now leaning hawkish; markets price in a potential October 2026 rate hike
The AI investment supercycle is the dominant driver of U.S. equity earnings growth in 2026–2027
Energy, commodities, and AI-adjacent equities are favored; long-duration bonds and REITs face headwinds
The K-shaped economy favors premium consumer brands and companies with AI productivity exposure over mass-market names
Use the Conference Board LEI, yield curve, and PMI as your primary leading indicators; use unemployment and CPI to confirm
This article is for educational and informational purposes only and does not constitute investment advice. All economic data cited is sourced from the Federal Reserve, Bureau of Economic Analysis, Bureau of Labor Statistics, The Conference Board, Deloitte, Morgan Stanley, JPMorgan, BlackRock, Fidelity, and Charles Schwab — all data current as of June 23, 2026. Investing involves risk including loss of principal. Past performance does not guarantee future results. Consult a qualified financial advisor before making investment decisions.