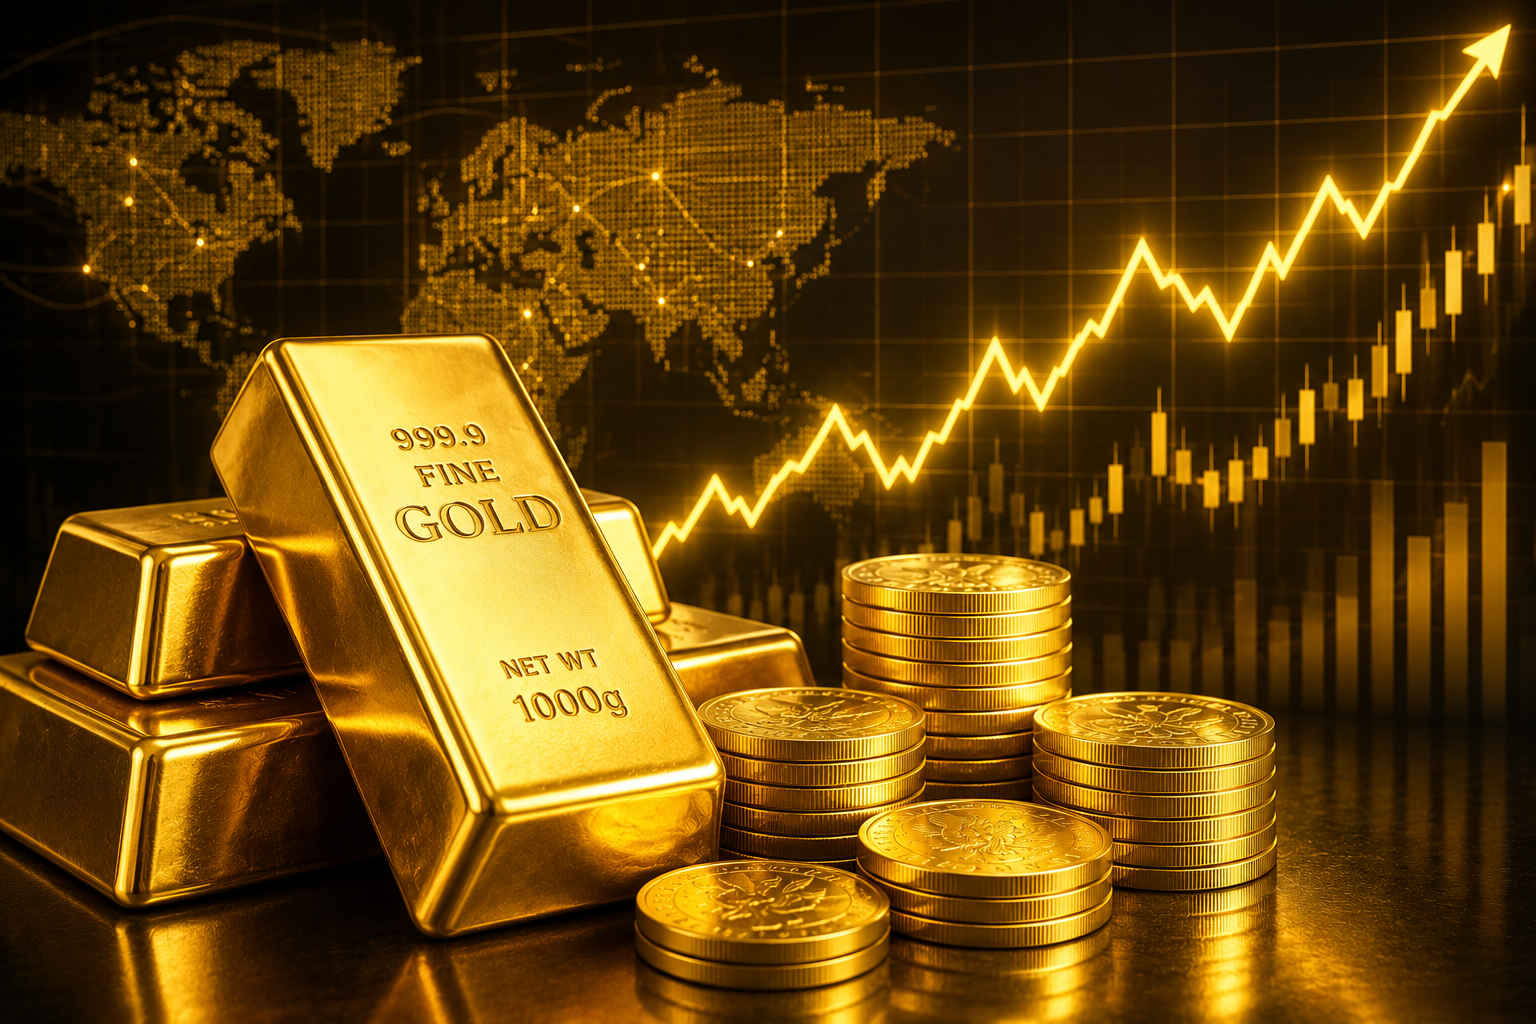
Gold has had one of the strangest years in its trading history. After climbing nearly 30 percent in a single month to set an all-time high near $5,600 an ounce in late January 2026, the metal then suffered its worst monthly decline since 2013, shedding more than 10 percent in March. By mid-June, gold was trading in the low $4,300s, still up sharply from a year earlier but well off its peak.
For investors trying to figure out what comes next, the honest answer is that 2026 has turned gold into a tug of war between two forces that rarely pull this hard at the same time: a structural, multi-year case for higher prices built on central bank buying and government debt levels, and a short-term case for caution built on a hawkish Federal Reserve and a resilient U.S. job market. This article breaks down both sides, walks through what the major banks are forecasting, and lays out the practical questions investors are asking right now.
Where Gold Stands Right Now
As of mid-June 2026, gold (XAU/USD) has been trading roughly between $4,280 and $4,500 an ounce, holding below its 50-day moving average while sitting comfortably above its 200-day average near $4,340. That is the technical definition of a market searching for direction.
The single biggest news event of the month was the Federal Reserve’s June policy meeting, the first under new Fed Chair Kevin Warsh. Markets had hoped a leadership change might bring faster rate cuts. Instead, Warsh struck a notably hawkish tone, declining to commit to a rate path while stressing that inflation has stayed above the Fed’s 2 percent target for years and that restoring price stability remains the priority. Gold fell almost 2 percent on the announcement.
Just as significant: a much stronger than expected May jobs report. The U.S. economy added 172,000 jobs against a Wall Street consensus closer to 80,000. That single data point did more damage to the bullish gold case than almost anything else this quarter, because it pushed the odds of a Fed rate hike by year-end toward 50-50 on interest rate futures markets, according to trading data tracked by BullionVault.
Adding another layer, gold caught a bid mid-June after President Trump signed an interim agreement aimed at ending the conflict involving Iran and reopening the Strait of Hormuz, a move that briefly pushed prices back above $4,300 as some geopolitical risk premium came out of oil and, by extension, inflation expectations.
Quick Snapshot
All-time high: roughly $5,600/oz (late January 2026)
Mid-June 2026 level: roughly $4,300 – $4,500/oz
March 2026 decline: worst single month since 2013
12-month change: still up about 25-30 percent year over year
Why Gold Spiked, Then Fell So Fast
To understand where gold goes next, it helps to understand why it moved the way it did. Three things happened in quick succession in early 2026.
First, the January melt-up. A combination of aggressive central bank buying, de-dollarization concerns, and worries about U.S. fiscal deficits sent gold up nearly 30 percent in a single month, an extraordinary move for an asset that typically grinds higher gradually.
Second, the February-March reversal. Gold dropped 14 percent in just three days in early February, then went on to post its sharpest monthly decline in more than a decade in March. Much of that selling was simple profit-taking after such a rapid run-up, but it was compounded by a separate shock.
Third, an oil-driven inflation surprise. Escalation in the conflict involving Iran pushed oil prices sharply higher in late February, and energy costs ended up accounting for more than 60 percent of the May Consumer Price Index increase, according to Bureau of Labor Statistics data. Higher oil meant higher inflation, which meant markets stopped pricing in Fed rate cuts and started pricing in the possibility of a hike instead. Higher rate expectations are normally bad for gold, because gold pays no interest or dividend, so the metal sold off even as geopolitical tension theoretically should have supported it.
That is the paradox of 2026 so far: the same conflict that should have been bullish for gold as a safe haven turned out to be bearish, because of what it did to oil prices and inflation expectations.
What the Major Banks Are Forecasting for the Rest of 2026
Wall Street’s gold forecasts have moved up dramatically since the start of the year, even after accounting for the correction. Here is where the major institutions stood as of June 2026.
Bank / Firm
Year-End 2026 Target
Notes
J.P. Morgan
$6,000 – $6,300
Most bullish major bank; sees central bank buying continuing into 2027
Goldman Sachs
$5,400
Reaffirmed target after the March correction
UBS
$5,500 (lowered from $5,900)
Cut target in May but kept a constructive longer-term view
Morgan Stanley
$5,700 (bull case)
Updated outlook tied to continued ETF inflows
ANZ
$5,800 (Q2 target)
Raised from a prior $5,400 target
BNP Paribas
$6,000
Expects the gold-silver ratio to keep rising
It is worth noting the spread here. Every one of these targets implies meaningful upside from the roughly $4,300 to $4,500 range gold was trading in through mid-June, which tells you something important: even after a brutal correction, institutional Wall Street has not abandoned its bullish thesis on gold for 2026. The disagreement is about how much higher, not whether higher is likely.
The World Gold Council takes a different approach, publishing probability-weighted scenarios rather than a single price target. Its 2026 outlook lays out three paths: a mild economic slowdown paired with falling rates, which it estimates could lift gold 5 to 15 percent; a global recession scenario, which would likely be strongly positive for gold as a safe haven; and a strong-growth scenario with a firmer dollar and higher rates, which it estimates could pull gold down 5 to 20 percent. That range itself tells you how wide the realistic outcomes are this year.
The Structural Case for Higher Gold Prices
Setting aside the week-to-week noise, the longer-term argument for gold resting on a higher floor than it did a few years ago comes down to a handful of durable trends.
Central bank buying. Central banks have been net buyers of gold for four consecutive years, a pattern of reserve diversification that analysts widely attribute to concerns about over-reliance on the U.S. dollar and U.S. Treasury debt as a reserve asset.
U.S. government debt. Federal debt now exceeds $37 trillion, with annual interest payments above $1 trillion, according to U.S. Treasury fiscal data. That dynamic feeds directly into the debasement and de-dollarization narrative that has supported gold buying from both central banks and private investors.
Persistent inflation. Core inflation was running at 2.9 percent as of the May 2026 reading, still meaningfully above the Fed’s 2 percent target even after years of tightening. Investors who view gold as an inflation hedge have had little reason to abandon that view.
ETF and private investor inflows. Beyond central banks, private investors have continued adding to gold-backed exchange-traded funds, a flow that analysts at Blue Line Futures and BNP Paribas both pointed to as a key support for prices heading into the second half of the year.
The Short-Term Risks That Could Cap Gold
None of the structural tailwinds above mean gold moves in a straight line. Several near-term risks could keep a lid on prices through the rest of 2026.
A genuinely hawkish Fed. Chair Warsh’s early signaling has surprised markets that expected a faster path to rate cuts. If the Fed actually hikes rates later this year rather than cutting them, that raises the opportunity cost of holding a non-yielding asset like gold and tends to strengthen the dollar at the same time, a double headwind.
A resilient labor market. The May jobs report is a reminder that strong economic data can move gold just as much as geopolitical headlines, simply because it changes the interest rate outlook.
Geopolitical de-escalation. Somewhat counterintuitively, progress toward resolving the conflict involving Iran has been a mild negative for gold in the short term, since it has eased the oil-driven inflation spike that was keeping rate-hike odds elevated, while also reducing the safe-haven bid.
Speculative positioning unwinding. After such an extreme run to all-time highs in January, some of the recent weakness simply reflects momentum traders and short-term speculators taking profits, separate from any change in the longer-term fundamental picture.
Gold vs. Silver: A Quiet Theme in 2026
One trend worth watching alongside gold itself is the gold-silver ratio, which measures how many ounces of silver it takes to buy one ounce of gold. Several banks, including BNP Paribas, expect this ratio to keep rising in 2026, meaning silver has lagged gold’s gains. Some analysts argue that makes silver relatively cheaper than gold compared to where it has historically traded, which is part of why a number of precious metals strategists have started highlighting silver as a complementary play for investors who already hold gold.
How Investors Are Approaching Gold Right Now
For everyday investors, the practical takeaway from all of this volatility is less about predicting the exact next move and more about how gold fits into a broader portfolio.
Treat gold as a long-term position, not a trade. Gold produces no income, unlike dividend-paying stocks or interest-bearing bonds. The case for holding it is about diversification and protection against currency debasement and inflation over years, not about timing a short-term bounce.
Size it appropriately. Most financial advisors who recommend gold suggest it as a modest portion of a diversified portfolio, commonly cited in the range of 5 to 10 percent, rather than a core holding, given how volatile the asset has proven to be this year alone.
Expect continued volatility. A 25 percent correction inside an otherwise intact longer-term uptrend is unusual but not unprecedented for gold. Investors who panicked and sold near the March lows missed the partial recovery that followed. The lesson many analysts are drawing from 2026 is that gold’s path higher, if it continues, is unlikely to be smooth.
Watch the Fed closely. With a new Fed chair still establishing his policy approach, every speech and data release is likely to move gold more than usual through the rest of the year. The next several jobs reports and inflation readings will matter more than almost anything else for short-term price direction.
Frequently Asked Questions
Will gold reach $6,000 an ounce in 2026?
It is possible but not guaranteed. J.P. Morgan and a handful of other banks have set year-end targets at or above $6,000, but that would require a substantial rebound from the roughly $4,300 to $4,500 range gold occupied through mid-June. Other major banks, including Goldman Sachs and UBS, see year-end levels closer to $5,400 to $5,500, still well above current prices but short of $6,000.
Why did gold fall so much after hitting an all-time high?
A combination of profit-taking after an unusually fast run-up, an oil-driven inflation shock tied to the conflict involving Iran, and a hawkish shift in Federal Reserve rate expectations all hit at roughly the same time, producing the steepest monthly decline in gold since 2013.
Is gold still a good hedge against inflation in 2026?
Core inflation remained above the Fed’s 2 percent target as of the most recent reading, and many investors continue to view gold as a hedge against persistent inflation and currency debasement, even though higher interest rates have offset some of that support in the short term.
How does the Fed affect the price of gold?
Gold pays no interest, so when the Fed raises rates or signals it might, bonds and savings accounts become relatively more attractive, which tends to pressure gold prices. When the Fed cuts rates or signals future cuts, the opposite tends to happen. The market’s uncertainty around new Fed Chair Kevin Warsh’s policy approach has been one of the biggest swing factors for gold in 2026.
Should I buy gold now or wait?
This is a personal financial decision that depends on your goals, time horizon, and existing portfolio. This article is for informational purposes only and is not financial advice. Investors should consider speaking with a licensed financial advisor before making any investment decision involving gold or other precious metals.
The Bottom Line
Gold’s story in 2026 has been one of extremes: a record-setting rally, a historic correction, and now a market caught between strong structural demand and a Federal Reserve that is not in a hurry to cut rates. The major banks still see meaningful upside from current levels by year-end, but the path is likely to stay volatile, shaped as much by jobs reports and Fed commentary as by the longer-term forces of central bank buying and government debt that originally drove gold to its highs.
For investors, the takeaway is less about predicting the next headline and more about discipline: understanding why gold is moving, sizing a position appropriately within a diversified portfolio, and being prepared for swings in both directions as the rest of 2026 unfolds.
Disclaimer: This article is for informational and educational purposes only and does not constitute financial, investment, or legal advice. Gold prices are volatile and forecasts from financial institutions are estimates, not guarantees. Always conduct your own research and consult a licensed financial advisor before making investment decisions.