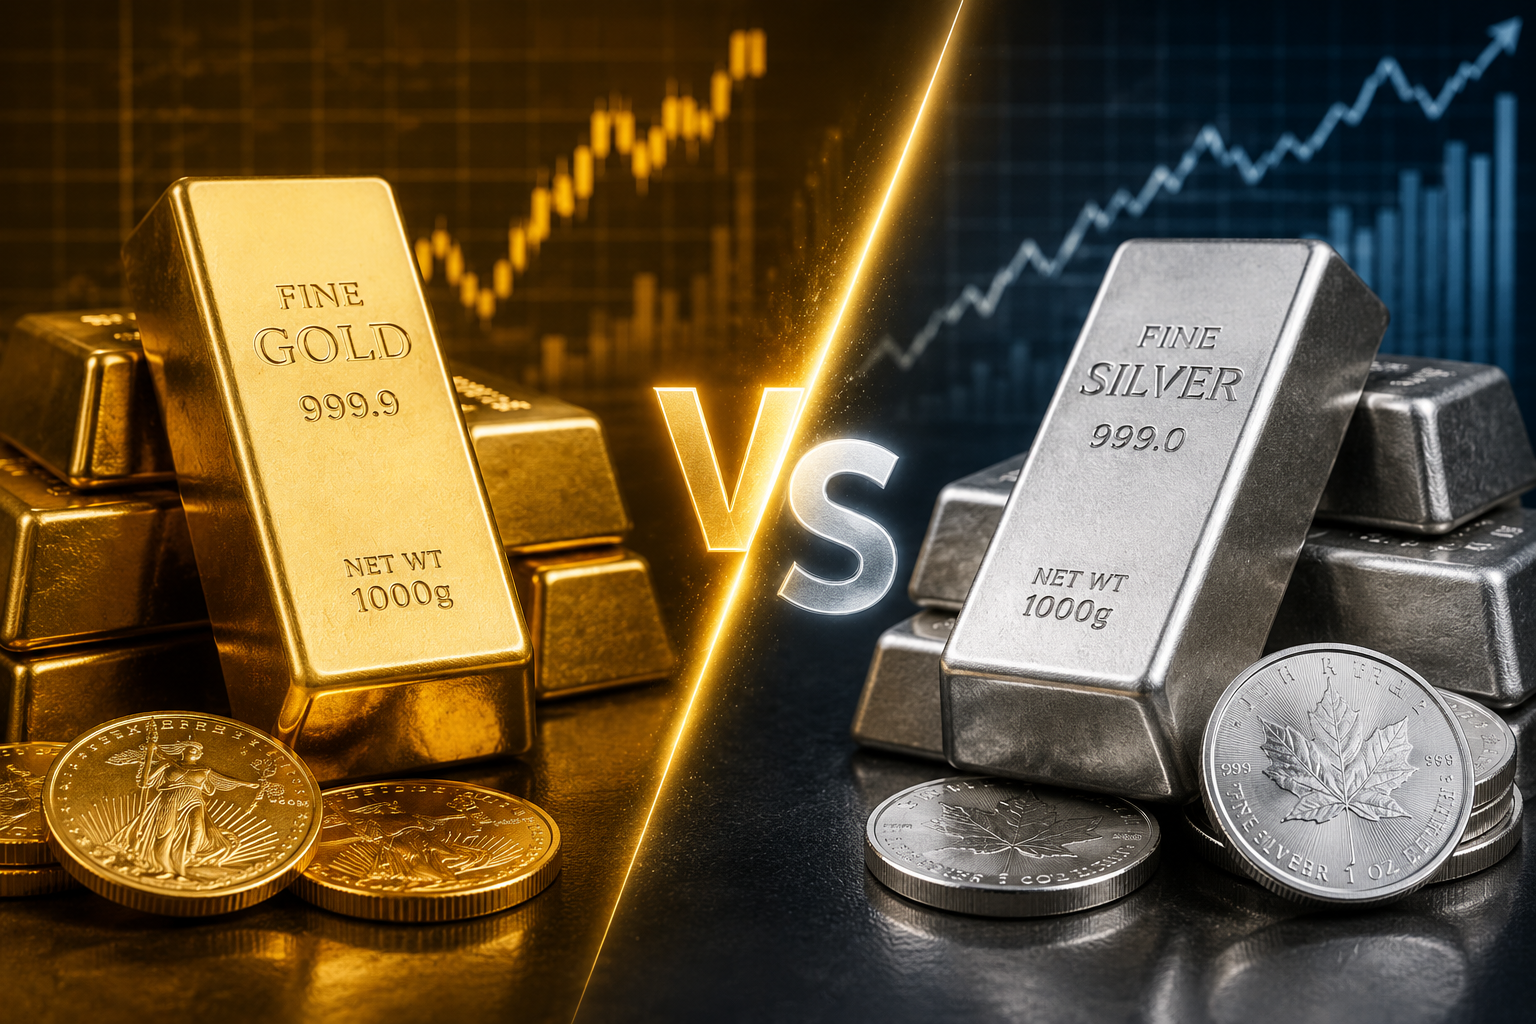
~$4,200 – $4,300/ozMid-June 2026, down roughly 25 percent from its January 2026 record near $5,589
Silver
~$66 – $74/ozMid-June 2026, down roughly 40 to 45 percent from its January 2026 record near $121.64
If you only glanced at the headlines from late 2025 and early 2026, you would think precious metals could do no wrong. Gold smashed records. Silver did even better, posting its strongest annual gain since 1979 and briefly touching levels few analysts thought possible. Then came a sharp correction in both metals, and a wide range of bank forecasts now span thousands of dollars apart on where gold and silver go from here.
So which one actually deserves a spot in your portfolio in 2026? The honest answer is that gold and silver play different roles, and the right choice depends on what you are trying to accomplish. This guide walks through how each metal has performed this year, what is driving prices, how they differ as investments, and how to think about allocating between them.
To understand where gold and silver stand today, it helps to see the full arc of the past twelve months. Both metals entered 2026 on a historic run, then gave back a meaningful chunk of those gains.
Gold’s record run and pullback
Gold climbed steadily through 2025 and pushed to an all-time high near $5,589 per ounce in January 2026. Since then, the metal has pulled back to trade in the roughly $4,200 to $4,300 range through mid-June 2026, a decline of close to 25 percent from the peak. Gold also suffered its largest monthly decline since June 2013 during a sharp drop in March 2026, rattling some short-term traders even as long-term institutional targets stayed elevated.
Silver’s even bigger swing
Silver’s move has been more dramatic in both directions. The metal surged roughly 147 percent in 2025, its strongest performance since 1979, breaking decisively above long-held resistance near $50 an ounce. That run carried silver to a nominal all-time high of $121.64 in January 2026. From there, silver corrected hard, falling by some estimates as much as 40 to 45 percent to trade around $66 to $74 per ounce by mid-June 2026.
Why Silver Moves More Than Gold
Silver’s 2026 year-to-date volatility has run more than double that of gold, according to industry estimates. The reason comes down to market size and use case: silver is a much smaller market than gold, so comparable dollar inflows or outflows produce proportionally larger price swings, in both directions.
What Is Driving Prices Right Now
Several overlapping forces have kept both metals in the headlines through the first half of 2026.
The Federal Reserve and interest rates
Precious metals are highly sensitive to the path of interest rates, since gold and silver pay no yield and become more attractive when bond yields and cash returns fall. The Fed cut rates in December 2025, which initially supported the rally into the new year. By mid-June 2026, however, the picture became more complicated. New Fed Chair Kevin Warsh has stressed that inflation has remained above the central bank’s target for an extended period, and roughly half of the Federal Open Market Committee has signaled that a rate hike, not a cut, may be necessary later in the year given inflation pressures tied partly to conflict in the Middle East.
Geopolitical tensions
Tensions involving Iran and the Strait of Hormuz have weighed on markets through the spring and into June 2026. An interim peace agreement between the United States and Iran was digitally signed, though it remained unclear whether shipping through the Strait had fully normalized. Gold in particular tends to catch a bid during episodes of geopolitical stress, since investors view it as a crisis hedge with no counterparty risk.
Central bank buying and de-dollarization
A structural theme running through nearly every 2026 forecast is continued central bank gold buying, often framed as part of a broader move toward diversifying away from the U.S. dollar. Several major banks now treat this as a permanent shift in demand rather than a temporary trend, which is part of why year-end 2026 price targets remain well above current trading levels despite the spring correction.
Silver’s industrial supply deficit
Silver’s story has an added layer that gold does not share. Roughly 55 to 60 percent of annual silver demand comes from industrial uses, including solar panels, electric vehicles, semiconductors, and data center infrastructure, compared with less than 10 percent of gold demand coming from industrial use. The Silver Institute has documented an ongoing structural market deficit for 2026, marking what would be a fifth or sixth consecutive year of supply shortfalls, even as some analysts flag efficiency gains in solar manufacturing as a potential headwind to long-term demand growth.
“Silver carries a dual identity that gold does not. In rate-hold environments, industrial metals face two simultaneous headwinds: risk-off sentiment reduces appetite for manufacturing-exposed assets, and delayed rate cuts mean slower economic growth expectations.”
2026 silver market analysis
2026 Price Forecasts: What Banks Are Saying
Forecasts for both metals span an unusually wide range this year, reflecting genuine uncertainty about the rate path and geopolitical backdrop.
Institution
Gold Year-End 2026 Target
Notes
J.P. Morgan Global Research
$6,000/oz (average), $6,300/oz possible in 2027
Cites continued central bank and investor demand
Goldman Sachs
$5,400/oz
Reaffirmed after the March 2026 pullback
UBS
$5,500/oz
Lowered from a prior target of $5,900/oz in May 2026
Citi
$4,000/oz
Trimmed from $4,300/oz, citing limited near-term upside
ANZ
$5,800/oz
Raised from a prior $5,400/oz target
Source
Silver 2026 Forecast
Notes
J.P. Morgan / LBMA consensus
$79 to $81/oz average
Broad institutional consensus range
World Bank
$70/oz average
More conservative institutional estimate
Reuters poll
$78/oz average
Reflects a higher consensus baseline than prior years
TD Securities
$44/oz average
Among the most bearish forecasts in the LBMA survey
GoldSilver.com bull case
Above $100/oz, up to $200/oz in extended bull scenario
Depends on continued supply deficits and ratio compression
The spread between the most bullish and most bearish silver forecasts, roughly $44 to $165 per ounce depending on the source, illustrates just how much disagreement exists about silver’s path this year. That wide range itself is a useful signal: silver is priced with far less consensus than gold, which tends to mean bigger moves in both directions as the picture clarifies.
Gold vs Silver: The Core Differences
Factor
Gold
Silver
Primary role
Monetary asset, crisis hedge, central bank reserve
Dual role as monetary asset and industrial metal
Industrial demand share
Less than 10 percent of annual demand
Roughly 55 to 60 percent of annual demand
2025 annual performance
Strong gains, though finished closer to flat versus silver’s surge
Approximately 144 to 147 percent gain, strongest since 1979
2026 volatility
Lower; roughly 46 percent year-to-date by one estimate
Higher; roughly 106 percent year-to-date by the same estimate
Held primarily by
Central banks, institutions, long-term investors
Investors, industrial buyers, manufacturers
Typical portfolio role
Core, stabilizing allocation
Higher-beta complement to a gold position
Storage and liquidity for physical holdings
High value density makes storage simpler
Lower value density means more physical bulk per dollar invested
The Gold-Silver Ratio Explained
The gold-silver ratio measures how many ounces of silver it takes to buy one ounce of gold. It is one of the most closely watched relationships in the precious metals market, and it has moved significantly over the past year.
The ratio fell below 67 in 2025, its lowest level since June 2021, as silver outperformed gold sharply.
By the spring of 2026, the ratio sat around 59 to 64, still below the long-run historical average of roughly 55 to 60, depending on which long-term window is used.
Some analysts argue the ratio no longer signals obvious silver undervaluation at current levels, removing one of the more reliable arguments for aggressively favoring silver over gold right now.
Others maintain that further ratio compression is likely if the Fed eventually cuts rates again, since rate cuts tend to draw ETF investors back into both metals, with silver’s smaller market amplifying the effect.
How to Use the Ratio
A high ratio suggests silver is cheap relative to gold on a historical basis, while a low ratio suggests the opposite. Many precious metals investors use the ratio to decide when to rotate between the two metals rather than treating it as a precise timing signal on its own.
Volatility and Risk Compared
Gold Risk Profile
Lower volatility relative to silver
Backed by deep central bank and institutional demand
Tends to hold value better during recessions and risk-off periods
Still vulnerable to sharp pullbacks, as seen in March 2026
Sensitive to real interest rates and dollar strength
Silver Risk Profile
Significantly higher volatility, in both directions
Industrial demand exposure adds a second variable beyond monetary sentiment
Can underperform sharply if global manufacturing activity slows
Smaller market size means price moves can be amplified by relatively modest capital flows
Lease rates for physical silver have hit record levels at times in 2026, signaling genuine delivery and supply stress
How to Actually Invest in Each Metal
1
Decide between physical metal and paper exposure
Physical bullion and coins give direct ownership with no counterparty risk, while ETFs and mining stocks offer easier liquidity and no storage burden but introduce other forms of risk.
2
Consider a precious metals ETF for simplicity
Gold and silver ETFs trade like stocks through a normal brokerage account and track the metal’s price without requiring you to store or insure physical bars or coins.
3
Look at a precious metals IRA for retirement exposure
Specialized custodians allow IRA accounts to hold physical gold and silver meeting IRS purity standards, which can be a tax-advantaged way to add metals to a retirement portfolio.
4
Factor in storage costs for physical silver
Because silver has much lower value density than gold, a large dollar investment in physical silver takes up significantly more physical space and may carry higher storage and insurance costs proportionally.
5
Set a target allocation rather than chasing momentum
Many financial advisors who recommend precious metals suggest a combined 5 to 15 percent portfolio allocation, with gold typically forming the larger position and silver making up a smaller, higher-volatility slice.
Head to Head Scorecard
Gold
Stability
Silver
Gold
Upside Potential
Silver
Gold
Crisis Hedge
Silver
Gold
Industrial Growth Exposure
Silver
Gold
Storage Efficiency
Silver
Gold
Entry Price Accessibility
Silver
This is not a contest with a single winner. Gold leads on stability, crisis-hedging, and storage efficiency. Silver leads on upside potential, industrial growth exposure, and a lower per-ounce entry price for new investors with smaller amounts to allocate. Most analysts who follow both metals closely describe the practical answer as owning both, with gold as the monetary anchor and silver as the higher-beta complement.
Who Should Own Gold, Who Should Own Silver
Gold tends to make the most sense for investors prioritizing capital preservation, a hedge against inflation and currency debasement, or a stabilizing asset to hold alongside stocks and bonds. It is also generally easier to store and insure relative to the dollar value held, which matters for investors who prefer physical bullion.
Silver tends to appeal more to investors comfortable with sharper price swings in exchange for greater upside potential, particularly those who want exposure to long-term industrial growth trends like solar energy, electric vehicles, and data center buildouts on top of silver’s traditional monetary appeal. Because the structural supply deficit and demand drivers play out over years rather than months, silver tends to reward a longer time horizon and a tolerance for significant short-term drawdowns, such as the one seen between January and June 2026.
A Word of Caution
Both metals just experienced a historic run followed by a sharp correction within the same six-month window. Forecasts for both gold and silver currently span an unusually wide range, which is a sign of real uncertainty, not a guarantee in either direction. Position sizing and time horizon matter more than ever in this environment.
Frequently Asked Questions
Is silver a better investment than gold in 2026?
It depends on your goals. Silver has higher upside potential and benefits from structural industrial demand, but it also carries significantly more volatility, as shown by its sharp rise to over $121 in January 2026 followed by a steep correction. Gold offers more stability and a longer track record as a crisis hedge. Many investors choose to hold both rather than picking one over the other.
Why did gold and silver prices fall after January 2026?
Both metals pulled back from record highs due to a mix of profit-taking after extraordinary 2025 gains, shifting expectations around Federal Reserve policy, and a stronger dollar at various points in the year. Gold also experienced its largest monthly decline since 2013 during a sharp drop in March 2026.
What is the gold-silver ratio and why does it matter?
The gold-silver ratio shows how many ounces of silver are needed to buy one ounce of gold. A high ratio suggests silver may be undervalued relative to gold based on historical norms, while a low ratio suggests the opposite. Investors often use it to help decide when to rotate between the two metals.
How much of my portfolio should be in precious metals?
There is no universal answer, but many financial advisors who recommend precious metals suggest a combined allocation of roughly 5 to 15 percent of a portfolio, with gold typically making up the larger share and silver a smaller, higher-volatility portion.
Is physical silver harder to store than physical gold?
Yes, generally. Silver has much lower value density than gold, meaning a given dollar amount of silver takes up significantly more physical space, which can increase storage and insurance costs proportionally compared to holding the same dollar value in gold.
Does silver really benefit from solar panels and electric vehicles?
Yes. Silver has strong electrical conductivity, which makes it valuable in solar panel manufacturing, electric vehicle components, and electronics. Roughly 55 to 60 percent of annual silver demand comes from industrial use, compared with less than 10 percent for gold, which is why silver prices are more sensitive to global manufacturing and green energy trends.
Should I buy gold and silver coins or an ETF?
Physical coins and bullion offer direct ownership with no counterparty risk but require secure storage and insurance. ETFs trade through a normal brokerage account and offer easier liquidity without storage concerns, but you do not hold the physical metal directly. The right choice depends on whether you prioritize direct ownership or convenience and liquidity.
Disclaimer: This article is for general educational purposes only and does not constitute financial or investment advice. Precious metals prices are volatile and can result in significant losses, as shown by the swings in both gold and silver throughout 2026. Always conduct your own research and consult a licensed financial advisor before making investment decisions. Forecasts cited from banks and analysts reflect their views at the time of publication and are not guarantees of future performance.
This article is reviewed periodically and was last updated on June 19, 2026, to reflect current market conditions.