The Benefits of Investing Consistently Instead of Timing the Market (2026 Guide)
Investing Strategy — Updated June 2026
76%
of the market’s best days occur in bear markets or early bull markets
94%
of all 10-year S&P 500 periods through Dec. 2025 produced positive returns
$10K
invested in 2002 became $60K+ by 2022 with buy-and-hold (9.52% avg annual)
8.48%
gap between S&P 500 and average equity investor return in 2024 (DALBAR)
Article Summary
The single most expensive investing mistake most Americans make is not picking bad stocks – it is trying to predict the best time to buy and sell them. Decades of research, including DALBAR’s ongoing annual study of investor behavior, consistently shows that the average equity fund investor earns dramatically less than the market itself. The gap was 8.48 percentage points in 2024 alone.
This article explains why consistent, systematic investing – often called dollar-cost averaging (DCA) – outperforms market timing in the real world, why 2026 is a particularly instructive year to study this dynamic, and exactly how to put a consistent investing plan into action. Covered topics include: the math of missing the market’s best days, behavioral finance research, the Schwab “Peter Perfect” study, how DCA performed through every major crash since 1929, and a step-by-step setup guide for U.S. investors.
Current 2026 context: The S&P 500 fell nearly 19% in April after Liberation Day tariff fears, then fully recovered by June. Investors who panic-sold in April missed one of the strongest two-month rallies in recent history. The pattern is not new. It is as old as markets themselves.
1. What Is Market Timing?
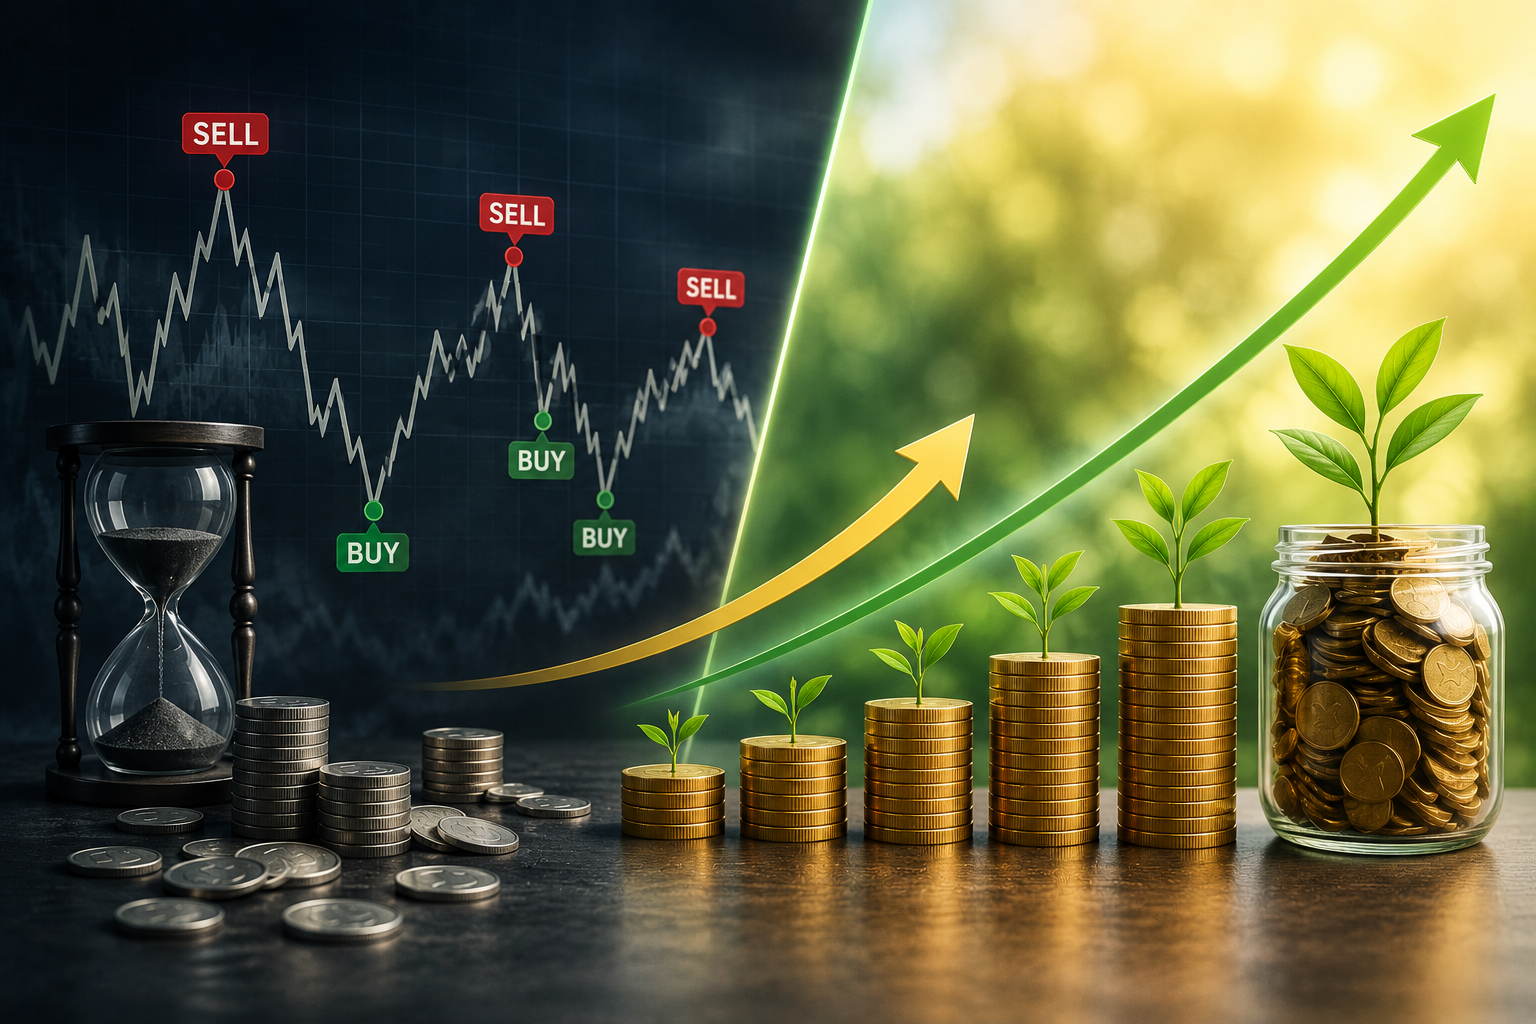
Market timing is the strategy of moving in and out of investments — or between asset classes — based on predictions about future price movements. At its simplest, it means waiting on the sidelines in cash until you believe the market is about to rise, then investing. At its most complex, it involves technical analysis, macroeconomic forecasting, options strategies, and algorithmic trading signals.
The idea sounds reasonable. If you could simply sell before crashes and buy back at the bottom, you would dramatically outperform a passive investor who held through the pain. The problem is that no individual investor, and very few professional ones, can do this consistently over time.
Strategy
Market Timing
Attempts to predict when to buy and sell
Requires being right twice (entry AND exit)
Highly emotional; driven by fear and greed
Causes investors to miss best market days
Incurs taxes and transaction costs
Proven to underperform over long periods
Even professionals fail to do it consistently
Strategy
Consistent Investing (DCA)
Fixed amount invested on a regular schedule
Removes emotion from the process entirely
Buys more shares when prices are low
Stays invested through all market conditions
Tax-efficient (fewer triggering events)
Proven to build wealth reliably over time
Works automatically in every 401(k)
The appeal of market timing is understandable, especially in a year like 2026 when headlines are screaming about tariff wars, Middle East conflict, sticky inflation, and an uncertain Federal Reserve. Every instinct tells you to step aside. But the data tells a completely different story.
2. What Is Consistent Investing (Dollar-Cost Averaging)?
Dollar-cost averaging (DCA) is the practice of investing a fixed dollar amount at regular intervals — weekly, bi-weekly, or monthly — regardless of what the market is doing. Because you are investing the same dollar amount each time, you automatically buy more shares when prices are low and fewer shares when prices are high. Over time, this produces an average purchase price that is lower than the average market price during the same period.
How Dollar-Cost Averaging Works: Hypothetical 10-Month Example
$300/month invested into an S&P 500 index fund
Notice the key mechanic: in March and April when the price dropped to $80 and $70, your fixed $300 purchased more shares than any other month. Those “crash purchases” are what reduce your average cost below the average market price. You didn’t need to predict the bottom. The strategy did the work automatically.
This is the foundational power of consistent investing: you transform volatility from a threat into an ally. Falling prices are not alarming — they are simply months when your regular contribution buys more.
3. The Brutal Math of Missing the Market’s Best Days
The most compelling argument against market timing comes from a simple analysis: what happens when you are out of the market on its best single days? The results are staggering and consistent across every time period studied.
Cost of Missing the S&P 500’s Best Days (July 1995 – June 2025)
Annual average return impact — Wells Fargo Investment Institute / Bloomberg
Over 30 years (1995–2025), a fully invested S&P 500 investor earned 8.4% per year on average. Missing just 10 of those best trading days cut returns nearly in half, to 5.33%. Missing 30 of the best days dropped the annual return to 2.1%, which was less than inflation over that same period. Missing 40 best days produced only 0.7% per year — essentially nothing after inflation.
The cruel twist? The best days cluster near the worst days. According to Hartford Funds data, 76% of the stock market’s best days occurred during a bear market or during the first two months of a bull market recovery. Of the 10 best single trading days over the past two decades, the vast majority happened within two weeks of the market’s largest one-day declines. The very moment investors are most tempted to step to the sidelines is statistically the most dangerous time to do so.
Key Research Finding
A 40-year analysis published by American Century Investments found that even if an investor with perfect information could somehow time every single market bottom over 40 years, dollar-cost averaging would still outperform that perfect-timing strategy 70% of the time — because the cash sitting on the sidelines earns nothing while waiting for the bottom.
When the accuracy assumption was reduced so that the investor invested within two months of the actual bottom (which is still far better than any real investor achieves), DCA outperformed 97% of the time.
4. The Schwab Study: Perfect Timing vs. Consistency
One of the most famous studies on this topic comes from the Schwab Center for Financial Research, which tracked five hypothetical investors over 20 years, each receiving $2,000 per year to invest in the S&P 500. The five investors used five different strategies:
Investor
Strategy
Final Value (20 years, $2K/yr)
Result
Peter Perfect
Invested at the exact market low each year
$186,077
1st Place
Ashley Action
Invested immediately on January 1 each year
$170,555
2nd Place
Matthew Monthly
Dollar-cost averaged monthly ($167/month)
$166,591
3rd Place
Rosie Rotten
Invested at the exact market peak each year
$154,105
4th Place
Larry Linger
Never invested; held cash in T-bills all 20 years
$44,438
Last Place
The findings are striking on multiple levels. First, the gap between perfect timing (Peter) and immediate consistent investing (Ashley) was only $15,522 over 20 years — a relatively small price to pay for eliminating the impossible task of predicting every annual market bottom. Second, even the worst-timed investor (Rosie, who somehow invested at every single annual peak for 20 consecutive years) still ended up with $154,105 from her $40,000 in contributions. Third, the investor who avoided the market entirely (Larry) ended up with less than a quarter of what even the worst-timed investor made.
“The best action that a long-term investor can take, based on our study, is to determine how much exposure to the stock market is appropriate and then just do it. Procrastination is the real enemy.”
Schwab Center for Financial Research
The scenario that matters most to most real investors is the comparison between Ashley and Matthew. Ashley invested everything at once on January 1; Matthew spread it out monthly. The difference was only about $4,000 over 20 years. For investors who lack either the courage or the lump sum to deploy capital all at once, monthly DCA produces nearly identical long-term results with far less emotional stress.
5. 2026: A Masterclass in Why Timing Fails
The year 2026 has already provided one of the most vivid real-world demonstrations of why market timing destroys wealth. Consider what happened in the first five months:
2026 Market Timeline
A Roller Coaster That Rewarded the Patient
January 2026: Tariff threats tied to Greenland ambitions trigger a market selloff. Iran tensions begin rising. Many investors begin moving to cash.
February 2026: Iran conflict escalates. Oil prices surge from $57/barrel toward triple digits. Consumer sentiment crashes. Recession fears mount. The S&P 500 experiences significant pressure.
April 2026: Oil peaks near $113/barrel. The S&P 500 suffers a drawdown of nearly 19% at its worst point. This triggered panic selling across retail investor platforms. Many market-timers moved entirely to cash.
Late April through June 2026: A ceasefire agreement between the U.S. and Iran sends oil prices down and markets into a powerful recovery. The S&P 500 climbs to new record highs by June. Investors who sold in April and waited for “clarity” missed the entire recovery. According to Macrobond, May and June 2026 were “some of the best months in recent market history.”
Year-to-date through April 20, 2026, the S&P 500 is up 4.23%. The index remains close to all-time highs as of late June. Investors who stayed the course and continued monthly contributions throughout the drawdown purchased shares near the bottom automatically.
This pattern repeated itself in 2025 as well. The tariff announcement on April 2, 2025 triggered two daily losses of more than 5%, followed immediately by a tariff pause that caused a gain of 9.5% on a single day (April 9, 2025). Investors who stepped out to avoid the drops missed the biggest single-day gain of the year.
Morningstar’s analysis of 2026 market volatility noted that despite an elevated VIX and multiple significant single-day moves, the S&P 500 quickly rebounded, placing 2026 in the same category as 2011 and 1987 — years of high short-term volatility that ultimately delivered positive returns for investors who stayed invested.
6. The Behavior Gap: Why Investors Underperform Their Own Funds
The most damning evidence against market timing comes not from academic models but from real investor behavior data. Every year since 1994, DALBAR’s Quantitative Analysis of Investor Behavior (QAIB) has tracked the actual returns earned by average equity fund investors versus the returns of the funds themselves. The gap is consistently enormous.
S&P 500 Index Return 2024
+25.02%
What a fully invested, passive holder earned last year
Average Equity Investor 2024
+16.54%
What the typical fund investor actually earned (DALBAR)
Behavior Gap 2024
8.48%
Return destroyed by buying high and selling low — second worst gap in 10 years
Worst Behavior Gap
10.32%
Gap in 2021 — the widest annual investor underperformance gap in a decade
An 8.48 percentage point gap in a single year is not a small rounding error — it represents the difference between roughly doubling your money in 10 years versus taking 16 years to do so. This gap exists entirely because of the decisions investors make: buying when the market feels safe (near peaks) and selling when it feels dangerous (near troughs). Dollar-cost averaging eliminates this gap by removing the human decision entirely.
Behavioral finance research has identified several psychological biases that drive the behavior gap:
Loss aversion: Research by Kahneman and Tversky showed that the pain of losing $1 feels roughly twice as intense as the pleasure of gaining $1. This asymmetry causes investors to cut losses prematurely and avoid getting back in after crashes.
Recency bias: Investors tend to extrapolate recent market performance. After a crash, they expect more crashes. After a bull market, they expect it to continue forever. Both lead to buying high and selling low.
Action bias: Particularly in volatile markets, the feeling that “I should be doing something” pushes investors to trade even when holding is the optimal strategy.
Availability heuristic: Vivid recent news events (tariff wars, Middle East conflict, Fed rate hikes) make investors feel that market crashes are more probable than they statistically are.
7. How Consistent Investing Performed Through Every Major Crash
One of the strongest arguments for consistent investing is its track record through every major market crisis in modern history. In each case, investors who kept contributing through the crash ended up in a dramatically better position than those who paused.
S&P 500 Recovery Timeline: Time from Crash Low to New All-Time High
Illustrative — historical S&P 500 data. DCA investors accumulated shares at lows in each period.
Even the 2008 financial crisis — a 57% peak-to-trough decline that shook the entire global financial system — recovered within roughly 5.5 years. Investors who kept their monthly 401(k) contributions running throughout 2008 and 2009 purchased S&P 500 index funds at prices between 40% and 57% below their 2007 peak. Those shares became extraordinarily valuable by 2013.
Capital Group’s research covering the 20-year period ending December 31, 2025 offers perhaps the most reassuring finding of all: even an investor who managed to pick the single worst day of every year to invest — the annual market peak — still turned $200,000 in total contributions into $801,554 over 20 years. The strategy of staying invested and continuing to contribute consistently overcame even perfectly bad timing.
8. The Compounding Advantage of Staying In
Compounding — earning returns on your returns — is the mechanism that makes long-term consistent investing so powerful. But compounding only works if you stay invested. Every period you spend on the sidelines is a period where compounding stops. And because compound growth is exponential rather than linear, the damage from missing early years is disproportionately large.
$400/Month Invested Consistently: Wealth Accumulation Over 30 Years at 8% Avg Annual Return
Hypothetical illustration. Does not account for taxes, fees, or inflation. Past performance does not guarantee future results.
The exponential curve above illustrates the “hockey stick” effect of long-term compounding. The $144,000 in total contributions grows to approximately $590,000 over 30 years at an 8% average annual return — a gain of roughly $446,000 from compounding alone. Notice that the curve barely moves in the first decade; most of the wealth creation happens in the final third of the period, when the accumulated base is large enough for the same percentage growth to produce massive absolute dollar gains.
This exponential dynamic means that the worst thing a consistent investor can do is interrupt the process. Pausing contributions for even one or two years early in the investment horizon can cost tens of thousands of dollars by year 30 — far more than the contributions themselves.
9. Myths About Market Timing, Debunked
MYTH
“I’ll just wait until the market calms down, then invest.”
FACT
Markets rarely give a clear all-clear signal. By the time conditions feel “calm,” the best recovery gains have already been made. The S&P 500 gained over 30% in 2019, 2021, and 2023 — years that did not “feel” safe at their starts because of trade wars, COVID variants, and banking stress respectively.
MYTH
“Professional fund managers time the market successfully.”
FACT
According to S&P’s SPIVA scorecard, roughly 90% of actively managed large-cap U.S. equity funds underperformed the S&P 500 over 15-year periods. Even with access to sophisticated tools, full-time research teams, and institutional data, professional timers fail to beat passive holding consistently. Individual investors have no meaningful edge here.
MYTH
“This time is different. The AI bubble / tariff shock / Middle East war really will cause a prolonged crash.”
FACT
“This time is different” is one of the four most expensive words in investing. Morningstar’s analysis of 100 years of market history shows that geopolitical events — wars, oil shocks, trade disputes, pandemics — consistently produce short-term volatility that resolves within 6–24 months. Investors who stayed invested through all of them outperformed those who fled to safety.
MYTH
“Dollar-cost averaging means I’ll miss out if the market goes straight up.”
FACT
In a straight-up market, lump-sum investing beats DCA because you would have had more money working earlier. But markets go straight up only in hindsight. The Schwab study showed that even in this best-case scenario, the lump-sum investor (Ashley) beat the DCA investor (Matthew) by only $4,000 over 20 years. The psychological and practical benefits of DCA easily justify this small theoretical cost for most investors.
MYTH
“I should time the market using economic indicators and the news.”
FACT
Markets price in current information extraordinarily fast. By the time an economic indicator has confirmed a trend and reached the general public through news media, the market has typically already adjusted. In 2026, when tariff headlines moved markets by 5% in a single day in both directions, professional traders with algorithmic systems reacted within milliseconds. Retail investors reading the morning news were trading on old information.
10. How to Set Up a Consistent Investing Plan
The best investment plan is one that runs on autopilot. Here is a step-by-step framework for putting consistent investing into practice.
01
Maximize Tax-Advantaged Accounts First
Before investing in a taxable brokerage account, max out your 401(k) to at least the employer match, and consider a Roth IRA (2026 contribution limit: $7,000; $8,000 if age 50+). The tax savings compound alongside your investment returns and dramatically improve long-term outcomes. Your 401(k) payroll deduction is already the most natural form of DCA in existence.
02
Choose a Diversified Core Investment
For most consistent investors, a low-cost S&P 500 index fund or a total U.S. market index fund forms the core. These funds have expense ratios as low as 0.03% at Fidelity and Vanguard. Adding an international fund and a bond fund provides further diversification appropriate to your time horizon. Resist the urge to pick individual stocks for your consistent investing contributions.
03
Automate the Contribution
Set up an automatic transfer from your checking account to your brokerage or Roth IRA on a fixed date each month, ideally the same day you receive your paycheck. Then set up automatic investment of that cash into your chosen fund. Both Fidelity and Vanguard allow fully automatic recurring investments with no minimums on fractional shares. Remove human decision-making from the equation entirely.
04
Reinvest Dividends Automatically
Enable dividend reinvestment (DRIP) on all holdings. This ensures that every quarterly dividend payment is immediately put back to work buying more shares, further accelerating compounding. In a bear market, DRIP automatically purchases more shares at depressed prices, amplifying the long-term recovery gain.
05
Set a Review Schedule, Not a Monitoring Schedule
The research is clear: investors who check their portfolios daily earn less than those who check quarterly. Set a calendar reminder for once per quarter to review whether your asset allocation still matches your goals and risk tolerance. Rebalance annually if any allocation has drifted more than 5 percentage points. Then close the app and let the automation run.
06
Increase Contributions When Your Income Grows
Each time you receive a raise or bonus, increase your automatic contribution by at least half the raise amount. This prevents lifestyle inflation from consuming your increased earning power while dramatically accelerating your wealth timeline. Many 401(k) plans offer an “auto-escalation” feature that does this automatically each year.
11. Best Platforms for Automatic Investing in 2026
Platform
Account Types
Auto-Invest Feature
Min. Investment
Expense Ratio (Index Funds)
Best For
Fidelity
401k, Roth IRA, brokerage
Yes — Automatic
$1 (fractional shares)
0.00%–0.015%
Best overall; zero-fee funds
Vanguard
Roth IRA, Traditional IRA, brokerage
Yes — Automatic
$1 (ETFs)
0.03%–0.10%
Long-term passive investors
Schwab
All account types
Yes — Automatic
$5
0.03%–0.06%
Full-service with research tools
Betterment
Roth IRA, Traditional IRA, brokerage
Yes — Core Feature
$10/month
0.25% mgmt + fund ER
Hands-off robo-advisor users
M1 Finance
Roth IRA, brokerage
Yes — Pie-based
$100 initial
Underlying fund ERs only
Custom portfolio automation
Employer 401(k)
401(k), 403(b)
Built-in via payroll
Usually $1
Varies (check plan)
Everyone — start here first
The best choice for most U.S. investors is to begin with the employer 401(k) for any available match, then add a Roth IRA at Fidelity for the zero-fee index funds and user-friendly auto-invest tools. Only after these are maximized should you consider a taxable brokerage account.
2026 Update
2026 Contribution Limits and Key Changes
401(k) employee contribution limit: $23,500 for 2026 (unchanged from 2025). Catch-up contributions for ages 50+: $7,500, bringing the total to $31,000. A new “super catch-up” for ages 60–63 allows an additional $11,250.
Roth IRA / Traditional IRA limit: $7,000 for 2026 ($8,000 age 50+). Phase-outs for Roth IRA begin at $150,000 (single) and $236,000 (married filing jointly).
Roth IRA income phase-out for single filers: $150,000–$165,000. For married filing jointly: $236,000–$246,000. Investors above these limits may consider a backdoor Roth IRA strategy.
Notable trend in 2026: U.S. Bank advises investors with excess cash to “invest extra cash gradually instead of all at once” given 2026 market volatility — a direct endorsement of consistent DCA methodology from a major institutional advisor.
12. Frequently Asked Questions
Is dollar-cost averaging always better than lump-sum investing?
Not always, in theory. When markets trend upward (which they do about 75% of calendar years), investing a lump sum immediately outperforms spreading it over time. The Schwab study found lump-sum investing outperformed DCA in about two-thirds of scenarios. However, for investors who receive income periodically (which is nearly everyone), DCA is the natural and practical approach. The real comparison is not DCA versus lump sum — it is DCA versus sitting in cash waiting for the “right time.” Against that alternative, DCA wins decisively.
What if I invest consistently and the market is flat for 10 years?
Flat markets are a real scenario, but they are rare over 10-year periods. Capital Group found that over the past 98 years, 94% of all 10-year S&P 500 holding periods produced positive returns. During a flat or down decade, DCA investors accumulate more shares at lower prices throughout — setting up dramatically larger gains when the eventual recovery comes. Japan’s Nikkei after 1989 is often cited as a counter-example, which is why diversification across geographies is important.
Should I stop investing in 2026 given the tariffs, Iran war, and Fed uncertainty?
No, and the 2026 story so far illustrates exactly why. The S&P 500 fell 19% in April after tariff fears and Iran conflict escalation. Investors who stopped contributing missed shares at those depressed prices. By June, the market had fully recovered and set new highs. If you stopped investing in April 2026, you locked in lower balances and missed the recovery. If you kept investing, you bought shares at a 15%–19% discount and benefited from the snapback.
How much money do I need to start consistent investing?
As little as $1 at Fidelity or $5 at Schwab, thanks to fractional share investing. Most financial advisors suggest starting with whatever amount you can commit to sustaining every single month without interruption — even if it is $50. The habit is more important than the amount, especially early on. Starting with $50/month and staying consistent beats starting with $500/month and stopping during market downturns.
What should I invest in for consistent dollar-cost averaging?
For most investors, a broad market index fund or ETF is the ideal vehicle for DCA contributions. The Fidelity Zero Total Market Index Fund (FZROX), Vanguard Total Stock Market ETF (VTI), or Schwab U.S. Broad Market ETF (SCHB) offer near-zero cost, instant diversification across thousands of U.S. companies, and automatic reinvestment. Adding a small allocation to an international index fund (such as VXUS) provides exposure to global growth opportunities.
Is it better to invest weekly, bi-weekly, or monthly?
Research shows minimal difference between these frequencies when transaction costs are zero (as they are at Fidelity, Vanguard, and Schwab for index fund purchases). Monthly contributions aligned with your pay schedule are the most practical approach for most investors and avoid the temptation to adjust timing based on short-term market moves. What matters is not the frequency but the consistency.
13. Key Takeaways
What This Article Has Shown — 13 Essential Points
Market timing requires being right twice (when to exit and when to re-enter) with near-perfect consistency. No one does this reliably over long periods.
Missing just 10 of the S&P 500’s best days over 30 years cut annual returns from 8.4% to 5.33% — a life-altering difference in final portfolio value.
76% of the market’s best single days occur during bear markets or at the very start of bull market recoveries — exactly when investors are most tempted to step aside.
The Schwab study found that even perfect market timing only outperformed immediate consistent investing by $15,522 over 20 years. The difference between perfect timing and worst-ever timing was less than $32,000 on $40,000 in contributions.
The DALBAR behavior gap in 2024 was 8.48 percentage points: the average equity investor earned 25.02% less than the S&P 500 returned. This gap is caused entirely by timing-driven buy-high/sell-low decisions.
In 2026, investors who panic-sold during April’s 19% drawdown missed one of the strongest two-month rallies in recent history, with May and June ranking among the best months in years.
Even the worst-timed investor in Capital Group’s study (investing at every annual market peak for 20 years) turned $200,000 into $801,554 by staying invested and continuing to contribute.
Dollar-cost averaging outperformed buying-the-dip strategies 70% of the time in a 40-year analysis by American Century, and 97% of the time when the “buy the dip” timing was even two months off from the exact bottom.
Compounding is exponential. Missing even one or two years of contributions early in an investment horizon costs far more than the skipped contributions themselves.
The three best vehicles for consistent investing are, in order: employer 401(k) with match, Roth IRA, then taxable brokerage. Automate all three to remove human decision-making.
Low-cost index funds (expense ratio under 0.05%) are the ideal target for consistent contributions. Fees compound negatively just as returns compound positively.
Quarterly reviews and annual rebalancing are appropriate. Daily portfolio monitoring is inversely correlated with investment returns.
The single most powerful sentence in personal finance: “Invest a fixed amount automatically every month, regardless of what the market is doing, and do not stop.”
The noise of 2026 — tariff wars, a new Fed chair pivoting hawkish, Middle East oil supply shocks, AI bubble debates, and a 19% S&P 500 drawdown that reversed in two months — is exactly the kind of environment that separates disciplined consistent investors from everyone else. The disciplined investors did nothing differently in April 2026 than they did in January 2026 or December 2025. They invested their fixed amount on their fixed date, reinvested their dividends, and did not look at the news.
The market rewarded them. It almost always does.
“Time in the market beats timing the market. It always has. It almost certainly always will.”
Paraphrased consensus from Schwab, Fidelity, Vanguard, Capital Group, JPMorgan, and 100 years of S&P 500 data
This article is for educational and informational purposes only and does not constitute investment advice, financial advice, or a recommendation to buy or sell any security. All data cited is sourced from Wells Fargo Investment Institute, Schwab Center for Financial Research, DALBAR, Capital Group, Hartford Funds, American Century Investments, Morningstar, U.S. Bank, Macrobond, The Motley Fool, and Bankrate. Historical data through June 2026. Investing involves risk including the possible loss of principal. Past performance does not guarantee future results. Contribution limits and income thresholds are for 2026 and may change. Consult a qualified financial advisor before making investment decisions.