
While fundamental analysis evaluates structural economic data and technical analysis tracks chart geometry, sentiment analysis measures something entirely different: human emotion. It is the quantification of the market mood, tracking the psychological spectrum between absolute panic and irrational exuberance.
Markets are not driven by cold calculations alone. They are driven by human beings and algorithms reacting to fear, greed, crowds, and uncertainty. Understanding sentiment analysis allows market participants to identify when the financial crowd has gone too far, turning emotional extremes into tradeable market edges.
1. The Psychology of the Market Cycle
Market sentiment moves in a predictable psychological loop that mirrors human emotions during an investment cycle. Prices do not just change based on financial reports; they shift based on how people feel about those reports.
At the absolute peak of a structural bull market, the prevailing mood is euphoria. Investors believe the upward momentum will never stop, prompting them to take on high levels of financial risk.
Conversely, at the absolute bottom of a bear market, the dominant mood is capitulation or depression. Investors sell off their assets regardless of long-term value simply to stop the emotional pain of losing money. This extreme panic represents the point of maximum financial opportunity.
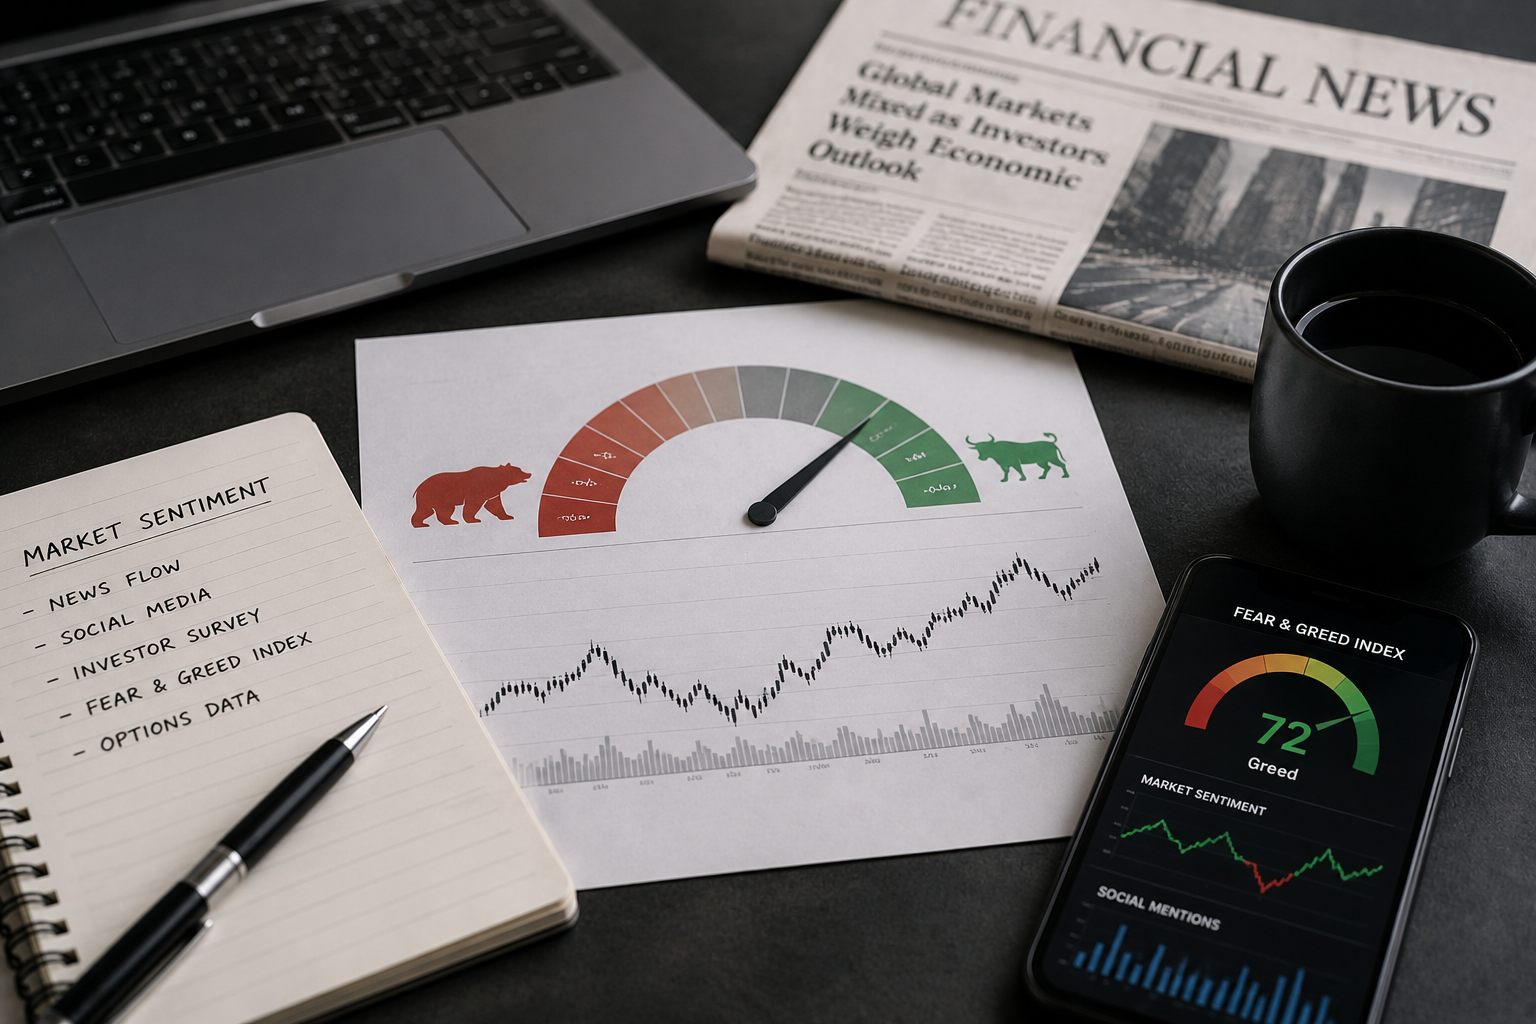
Multi-Asset Market Sentiment Index
Live psychological pulse and retail vs. institutional order flow divergence.
Psychological Data Inputs
Contrarian Execution Strategy
The broader market environment tracks in an emotional equilibrium. Institutional option execution balances retail demand patterns perfectly. Avoid over-leveraged directional entries until an extreme divergence opens up.
2. Core Quantitative Metrics for Tracking the Market Mood
Traders do not rely on guesses to measure public emotion. They use specific quantitative metrics and sentiment indicators to gauge public psychology.
The CBOE Volatility Index (VIX)
Often referred to as the investor fear gauge, the VIX tracks the implied volatility of S&P 500 index options over the next 30 days.
- High VIX Reading (Above 30): Signals widespread panic, high uncertainty, and aggressive institutional buying of protective put options.
- Low VIX Reading (Below 15): Signals extreme complacency, low perceived risk, and calm market conditions.
The Put/Call Ratio
This metric compares the total trading volume of bearish put options against bullish call options.
- Ratio Greater Than 1.0: Shows that market participants are buying more puts than calls, indicating a bearish consensus.
- Ratio Lower Than 0.60: Shows that call buying heavily dominates, revealing highly confident or greedy market conditions.
The High-Low Index
This index compares the number of stocks hitting 52-week highs against those plunging to 52-week lows. It helps confirm whether a market rally is supported by the majority of equities or driven artificially by just a few mega-cap stocks.
3. Sentiment Benchmarks Across Key Asset Classes
Different financial sectors have unique benchmarks designed to isolate the psychological state of their specific participants.
| Sentiment Benchmark | Target Asset Class | Analytical Utility |
| AAII Investor Survey | US Retail Equities | Measures the percentage of individual investors who are bullish, bearish, or neutral over a six-month horizon. |
| Commitment of Traders (COT) | Commodities & Forex | A weekly report showing the net long and short positions held by commercial hedgers and large institutional speculators. |
| Crypto Fear & Greed Index | Digital Assets & Crypto | Combines price volatility, social media volume, search trends, and market share into a single sentiment score from 0 to 100. |
Evaluating these benchmarks helps asset managers identify when specific market sectors are approaching emotional exhaustion.
4. Current Market Context: Divergence and Institutional Dynamics
Market sentiment calculations show notable divergence across various global assets. In equity markets, broader corporate profiles show a mix of institutional caution and underlying optimism. For example, recent institutional survey metrics released by S&P Global note that the Risk Appetite Index compiled from major global money managers cooled to a more conservative +8% reading in June, down from +17% in May.
This cooling sentiment stems from mixed macroeconomic signals. Investors are weighing extended asset valuations and shifting monetary expectations against highly resilient corporate earnings, particularly within corporate technology sectors tied to global artificial intelligence infrastructure.
At the exact same time, digital asset sectors are recovering from a period of severe retail panic. Earlier phases saw the Crypto Fear & Greed Index drop deep into extreme fear territories, hitting single-digit levels as low as 9 out of 100 due to shifting macro crosscurrents and geopolitical tensions.
Data shows an interesting structural gap during that emotional wash-out: while short-term retail speculators capitulated, long-term institutional participants accelerated their accumulation. Large buyers acquired substantial quantities of core digital assets on-chain, proving that institutional accumulation often builds a solid floor underneath retail panic.
5. Contrast and Synergy: Sentiment vs. Fundamentals and Technicals
To maximize trading precision, sentiment analysis should not be used in a vacuum. It works best when combined with fundamental and technical analysis.
The Fundamental Anchor
Fundamentals establish the structural boundaries of value. When sentiment becomes detached from underlying economic reality, a major market correction is usually brewing.
The Technical Trigger
Technical analysis reveals the exact structural levels where a sentiment shift is starting to impact prices. While sentiment shows that a market is prime for a reversal, technical indicators like a moving average crossover or a support bounce provide the actual entry execution signal.
7. The Contrarian Framework: Exploiting Psychological Extremes
The core rule of sentiment analysis is contrarianism: Buy the panic, sell the hysteria.
When a sentiment indicator hits an extreme level, it means the majority of market participants have already acted on their beliefs. If the AAII retail survey shows 85% of investors are intensely bearish, it means they have already sold their shares or shorted the market. With no sellers left to push prices down, the path of least resistance turns upward.
Successful contrarian trading requires strict risk discipline. Sentimental extremes can stay extended longer than rational models predict. Traders use momentum oscillators alongside strict stop-loss rules to ensure they do not step in front of an emotional market trend too early.
Summary Checklist for Measuring the Market Mood
Before executing a position based on market sentiment, review this diagnostic checklist:
- Is the VIX index trading at historical extremes that suggest an overextended market?
- Does the Put/Call ratio confirm that options hedging has reached an unsustainable emotional peak?
- Are retail sentiment surveys showing heavy imbalances that conflict with long-term institutional flows?
- Has price action reached a major support or resistance level to confirm the sentiment reversal?
- Are you trading with a clear risk-to-reward ratio to safeguard capital if the emotional trend extends?
By tracking public emotion instead of getting caught up in it, traders can transform volatile market swings into structured, objective opportunities.