
Market prices do not move by accident. They move because of a constant battle between buyers and sellers, which displays clearly on price charts. Whether you trade classic stock indices like the S&P 500, track the fast moving artificial intelligence tech sector, or manage digital currencies like Bitcoin, mastering technical analysis gives you a distinct edge over the competition.
This guide provides an in depth look at modern chart structures, essential math overlays, and real time risk management frameworks. It incorporates active market behavior from June 2026 to help you navigate modern markets with confidence.
1. Core Principles Of Technical Analysis
Technical analysis builds on a simple idea: past price actions and volume trends tend to repeat because human psychology remains consistent under financial pressure. While fundamental analysts study balance sheets, cash flow metrics, and macroeconomic data points, technical traders look directly at the price engine itself.
Three central pillars anchor this entire discipline:
- The Market Discounts Everything: Every piece of known information, including corporate earnings reports, geopolitical tensions, and monetary changes, reflects immediately in asset prices.
- Prices Move In Trends: Asset prices are more likely to sustain an established direction than to break it randomly.
- History Tends to Repeat: Identifiable geometric structures on price charts reflect clear, recurring shifts in investor sentiment.
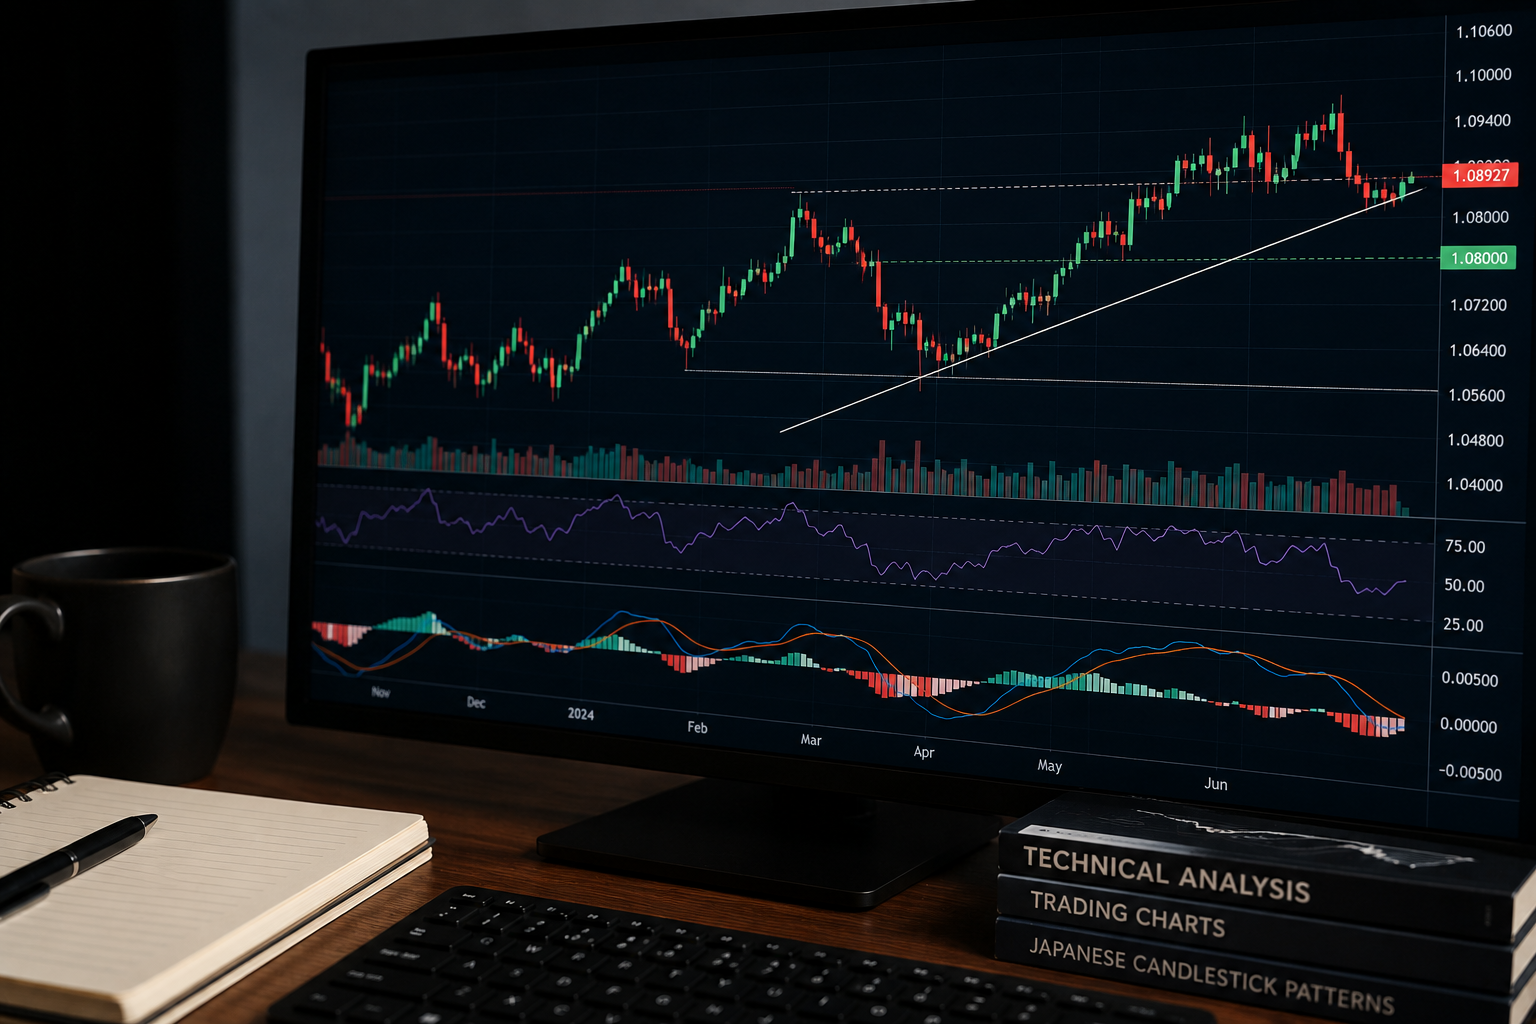
The primary visual building block for modern traders is the Japanese candlestick chart. Each individual candle provides five data points over a chosen period: the opening price, highest price, lowest price, closing price, and the net price direction.
When the closing price finishes higher than the opening price, the candlestick body is bullish (typically green or hollow). When the closing price finishes lower than the opening price, the candlestick body is bearish (typically red or solid). The thin lines extending above and below the body represent the upper and lower shadows, revealing price rejection extremes.
Moving Average Simulator
2. Key Chart Patterns And Market Trends
Recognizing systemic chart formations helps traders anticipate trend continuations and major market reversals. These formations fall into two clear structural buckets.
Reversal Formations
Reversal setups alert traders that an active trend is running out of steam and a change in direction is likely. Famous examples include the Head and Shoulders pattern, Double Tops, and Double Bottoms. A Head and Shoulders pattern presents three distinct price peaks: a central high peak (the head) flanked by two lower, roughly equal peaks (the shoulders). A decisive break below the connecting reaction lows (the neckline) confirms that sellers have taken over.
Continuation Formations
Continuation setups show that a market is pausing briefly before resuming its primary trend. Common continuation shapes include flags, pennants, and rectangles. A bullish flag consists of a sharp upward price move (the flagpole) followed by a tightly bounded, downward sloping consolidation channel (the flag). When price breaks above the upper boundary of this channel, it signals a new surge of buying power.
Let us break down how these classic shapes appear in real financial markets.
| Formation Type | Common Names | Structural Meaning | Target Determination |
| Reversal | Head and Shoulders, Double Top | Buyers are exhausted; market control is flipping to sellers. | Measure the vertical height of the pattern and project it downward from the breakout line. |
| Reversal | Double Bottom, Inverse Head and Shoulders | Sellers are exhausted; market control is flipping to buyers. | Measure the vertical depth of the pattern and project it upward from the breakout line. |
| Continuation | Bullish Flag, Bullish Pennant | The market is taking a brief pause during an active upward trend. | Measure the height of the preceding flagpole and add it to the breakout point. |
| Continuation | Bearish Flag, Bearish Rectangle | The market is taking a brief pause during an active downward trend. | Measure the depth of the preceding flagpole and subtract it from the breakdown point. |
3. Mathematical Indicators And Overlays
While price charts show pure market behavior, mathematical indicators help smooth out random market noise to reveal underlying momentum trends. Experienced traders typically combine trend tracking indicators with momentum oscillators to avoid false signals.
Moving Averages (MA)
Moving averages calculate smooth average price tracking lines over a specified number of bars.
- Simple Moving Average (SMA): Calculates an unweighted mean price over the selected timeline.
- Exponential Moving Average (EMA): Places higher mathematical weight on recent prices, making it react faster to current market shifts.
Traders track key crossovers to find long term macro trends. For example, when a short term line like the 50 day EMA crosses above a long term line like the 200 day EMA, it forms a highly bullish Golden Cross setup. When it crosses below, it creates a bearish Death Cross.
Moving Average Convergence Divergence (MACD)
The MACD measures momentum changes by calculating the relationship between two distinct exponential moving averages. It subtracts a 26 period EMA from a 12 period EMA to build the primary MACD line. A 9 period EMA of that result is then plotted alongside as a signal line to trigger entry and exit alerts.
When the fast moving MACD line crosses above the slower signal line, it confirms accelerating upward momentum. Conversely, when the MACD line drops below the signal line, it shows expanding downward pressure.
4. Modern Market Applications (June 2026 Update)
To apply technical analysis successfully, you must adjust your strategies to current market conditions and structural volatility regimes. The financial landscape in June 2026 shows deep bifurcation between traditional asset classes and high growth tech assets.
Equity Markets and the AI Trade
Traditional equity indices are trading at or near all time highs, driven by incredible earnings growth in the technology sector. The S&P 500 Index has powered past the 7600 level, backed by corporate earnings expanding at a year over year rate near 30%. However, this growth remains highly concentrated. Leading tech names are seeing massive intraday price swings, with firms like Dell jumping over 32% in a single post earnings session.
From a chart view, this extreme momentum has pushed many tech assets deep into overbought territory on the Relative Strength Index (RSI). When an asset climbs above an RSI value of 70, disciplined technical traders avoid chasing the breakout blindly. Instead, they look for bullish flags or key moving average retests on the daily chart before deploying capital.
Traders are also keeping a close eye on the calendar as high profile market listings arrive. Massive offerings like the SpaceX Initial Public Offering and expected filings from top artificial intelligence houses are competing directly for investor capital. Technical analysts track market breadth indicators to ensure that funds pulling out of existing tech names to purchase new listings do not trigger a broader 10% market correction.
Crypto Asset Volatility and Structure
The digital currency landscape shows a clear shift toward asset tokenization, regulated dollar liquidity instruments, and automated trading networks. According to recent data from Pantera Capital, real world asset tokenization and stablecoin supplies have expanded dramatically, providing a solid foundation of underlying market liquidity.
Even with these strong foundations, individual altcoin profiles remain highly volatile, with many enduring significant drawdowns after speculative cycles clear out. Bitcoin continues to serve as the primary proxy for global risk sentiment.
From a technical chart perspective, Bitcoin is navigating compressed volatility windows, punctuated by sharp, narrative driven breakouts. Because institutional flows through spot market exchange traded funds now dominate order books, classic support and resistance levels around psychological round numbers carry much more technical weight than they did in past cycles.
5. Volatility Analysis: Average True Range (ATR)
To protect your trading account from sudden market swings, you must track shifting volatility metrics. The Average True Range (ATR) indicator calculates the average boundary distance between market highs and lows over a set number of periods. It does not identify future price direction; instead, it measures the immediate structural volatility of the asset.
During periods of intense macro events, such as unexpected changes in global trade routes, oil prices can fluctuate wildly. For instance, Brent crude futures recently dropped nearly 20% in a single month toward 97 dollars a barrel based on shifting de-escalation rumors. This type of severe price action causes a sharp spike in the ATR line.
When the ATR values rise significantly, prudent risk management dictates that you widen your stop loss parameters to prevent getting stopped out by random market noise. To balance this wider safety margin, you should reduce your total position size so that your total dollar risk per trade stays exactly the same.
6. Support, Resistance, And Volume Profile
The most reliable horizontal zones on any chart are support and resistance levels. Support is a low price zone where buying interest is consistently strong enough to overcome selling pressure, halting a downward slide. Resistance is a high price zone where selling interest routinely overpowers buying enthusiasm, stopping an upward climb.
To confirm the validity of these horizontal levels, you must analyze underlying volume characteristics. Classic volume bars at the bottom of a chart reveal how much trading activity occurred over a specific block of time.
A more modern tool is the Volume Profile overlay, which plots a horizontal histogram across the side of the chart. This profile shows exactly how much volume traded at specific price levels rather than periods of time. The highest horizontal peak on this histogram is known as the Point of Control (POC). Because the POC represents the exact price level where the maximum amount of institutional capital changed hands, it acts like a powerful financial magnet, serving as rock solid support or resistance during future market retests.
7. A Pro Trader’s Comprehensive Trading Framework
Sustained trading success requires combining chart analysis with systematic trade execution rules. This professional checklist ensures you maintain structural discipline on every market entry.
1.Identify the Macro Trend Direction
Examine the daily and weekly price charts using the 50 day and 200 day EMA lines. Only look for long entry setups if the broader macro trend points upward. Only look for short setups if the master trend points downward.
2.Locate Key Horizontal Structural Zones
Draw your primary support and resistance lines across the chart. Look for intersections with high volume peaks on the Volume Profile to find zones where large institutions are active.
3.Wait for an Explicit Candlestick Trigger
Monitor your chosen horizontal zones on lower timeframes. Look for crisp confirmation signals, such as an engulfing candlestick or a decisive breakout from a clear continuation flag.
4.Calculate the Risk to Reward Profile
Place your stop loss order just outside the invalidation zone of the pattern. Identify your profit target at the next major horizontal resistance line. Ensure the potential reward is at least twice as large as your total dollar risk.
5.Execute and Manage the Active Trade
Deploy your trade using calculated position sizes based on current ATR metrics. Once the price advances toward your first key technical target, move your stop loss order to the entry breakeven point to remove your capital risk.
Summary: Building Consistency Through Analytical Discipline
Technical analysis is not an idealistic search for a flawless forecasting crystal ball. It is a systematic framework designed to find high probability setups, manage risk, and exploit recurring market patterns.
By combining clean candlestick structural analysis with volume tracking indicators and strict risk parameters, you can strip emotion out of your trading execution. Keep your position sizes conservative, stay aligned with macro trends, and let the historical data guide your view of the market.