
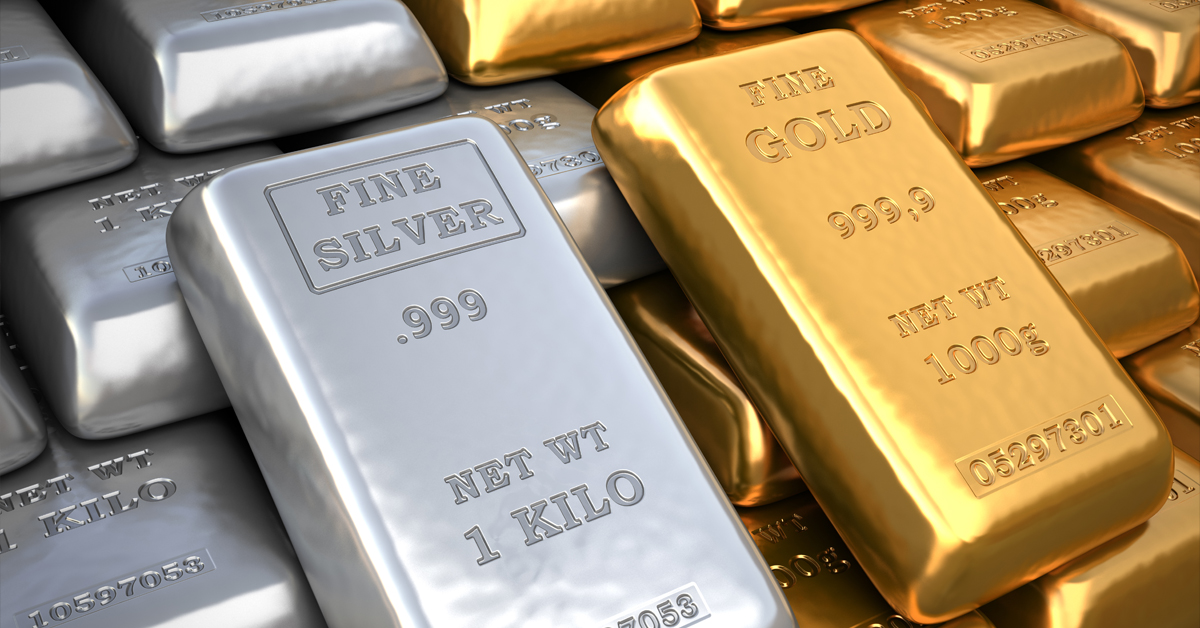
The global commodities market has entered a historic supercycle, forcing institutional and retail investors to reassess tangible assets. As macroeconomic landscapes fracture under fiscal imbalances and shifting trade architectures, the classic debate of Gold (XAU) vs Silver (XAG) has taken on a new structural dimension.
In 2026, the traditional view of precious metals is changing. Gold has set nominal price highs, sustained by unprecedented central bank accumulation. Meanwhile, silver is experiencing a supply squeeze driven by green energy mandates, photovoltaic advancements, and AI hardware infrastructure.
This comprehensive analysis breaks down the market data, technological changes, and macroeconomic drivers to help you construct a resilient commodity strategy.
The Macroeconomic Backdrop: A Tale of Two Metal Profiles
While both assets serve as hedges against inflation and currency debasement, they operate under entirely different supply and demand mechanics.
+-------------------------------------------------------+
|   THE PRECIOUS METALS BIFURCATION                     |
+-------------------------------------------------------+
|                                                       |
|   GOLD (XAU)                                          |
|   [ Monetary Anchor ]                                 |
|                                                       |
|   * Ultimate Safe Haven & Non-Liability Asset         |
|   * Driven by Global Sovereign Reserves               |
|   * Lower Volatility, Pure Monetary Premium           |
|                                                       |
|   SILVER (XAG)                                        |
|   [ Dual-Identity Metal ]                             |
|                                                       |
|   * Critical Industrial Input (Solar/AI)              |
|   * 5+ Consecutive Years of Structural Deficits       |
|   * High Volatility, Asymmetric Upside                |
|                                                       |
+-------------------------------------------------------+
Gold: The Sovereign Wealth Shield
Gold is the ultimate monetary asset, free from third-party liability. It has no industrial replacement and cannot be programmatically inflated or devalued by decree. In 2026, gold behaves less like a speculative trade and more like an independent, sovereign tier-one asset used to diversify away from Western fiat currencies.
Silver: The Strategic Industrial Co-Product
Silver is a dual-identity asset: it carries a historical monetary premium alongside intense industrial utility. Over 50% of global silver demand is tied to industrial applications.
Furthermore, silver is inelastic; roughly 70% of silver output is mined as a secondary byproduct of copper, lead, and zinc operations. This means higher silver prices cannot quickly trigger an increase in mine production.
2026 Price Performance and Major Milestones
The precious metals complex has seen strong price action, though each metal has followed a distinct path:
| Metric | Gold (XAU) | Silver (XAG) |
| 2026 Average Spot Price | ~$4,400 – $4,540 / oz | ~$74 – $75 / oz |
| All-Time Highs (Early 2026) | ~$5,602 / oz | ~$121.62 / oz |
| 2025 Retrospective Performance | ~+41% advance | ~+130% surge |
| Primary Demand Driver | Institutional & Central Bank Bar/Coin Buying | PV Solar Cells, EVs, AI Server Hardware, Semiconductors |
| Supply Dynamics | 3.1% modest supply growth via recycling/mining | 6th Consecutive Year of Structural Supply Deficits |
Deep Dive: Key Drivers Shaping Gold (XAU)
1. De-Dollarization and the New Wave of Central Bank Allocations
According to data from the World Gold Council, central bank net purchases have reached historic levels. Emerging market and non-Western central banks are actively diversifying away from U.S. Dollar and Euro-denominated reserve assets.
                +----------------------------------------+
                |     CENTRAL BANK RESERVES IN 2026      |
                +----------------------------------------+
                                    |
          +-------------------------+-------------------------+
          |                                                   |
          v                                                   v
+--------------------+                               +--------------------+
| Traditional Buyers |                               | New Entrants       |
| * Poland           |                               | * Indonesia        |
| * Uzbekistan       |                               | * Malaysia         |
| * Kazakhstan       |                               | * Kenya & Uganda   |
+--------------------+                               +--------------------+
          |                                                   |
          +-------------------------+-------------------------+
                                    v
                 [ Sustained Structural Floor Under XAU ]
Sovereign buying is expanding beyond traditional accumulators. Countries like Indonesia, Malaysia, Uganda, and Kenya have launched dedicated domestic gold-buying programs to safeguard their reserve sheets. This creates a steady long-term demand floor that operates independently of retail investor sentiment.
2. Fiscal Deficits and Debt Crises
With the United States fiscal debt expansion continuing, institutional firms like Goldman Sachs have noted a distinct increase in physical bullion buying among high-net-worth families. This “debasement trade” is driven by concerns over structural inflation, causing many investors to view gold positions as permanent, long-term portfolio hedges.
Deep Dive: Key Drivers Shaping Silver (XAG)
1. The Solar, EV, and Artificial Intelligence Supply Crunch
Silver’s electrical and thermal conductivity is unmatched by any substitute metal, making it an essential component in modern technology infrastructure.
- Photovoltaic Solar Energy: Rapid expansion of global clean energy infrastructure has turned solar panel manufacturing into a major source of silver consumption. Next-generation solar cells require significantly more silver per megawatt than older models.
- AI Data Centers and Hardware: The boom in high-performance computing, AI server architectures, and advanced semiconductor packaging relies heavily on silver-plated components to handle intense data and power loads.
- Automotive Electrification: Electric vehicles (EVs) use nearly twice as much silver as internal combustion engine vehicles, due to complex wiring harnesses, control units, and charging network infrastructures.
2. A Prolonged Structural Deficit
According to the Silver Institute’s 2026 reports, the silver market is facing its sixth consecutive year of structural supply deficits.
Industrial demand is rising fast while mine supply remains rigid, drawing down above-ground institutional stockpiles. This fundamental imbalance makes silver an attractive asymmetric option in the commodities sector.
Understanding the Gold-to-Silver Ratio
The Gold-to-Silver Ratio (GSR) measures how many ounces of silver it takes to purchase a single ounce of gold. Historically, this ratio has served as a reliable indicator for identifying which metal is undervalued relative to the other.
$$\text{Gold-to-Silver Ratio} = \frac{\text{Price of Gold per Ounce}}{\text{Price of Silver per Ounce}}$$
During the multi-year commodity bull market, the ratio has trended down from historical highs above 85:1. This compression reflects silver’s tendency to outperform gold in high-growth, inflationary environments.
When global industrial demand outpaces mine supply, the ratio compresses toward its historical structural averages, offering significant opportunities for investors who rebalance between the two metals.
Investment Allocation Verdict
Choosing how to split your allocation between gold and silver depends on your specific financial goals, risk tolerance, and portfolio setup.
- Maximize Your Allocation to Gold (XAU) if: Your primary goals are wealth preservation, downside protection during geopolitical uncertainty, and low-volatility portfolio insulation. Gold remains the baseline asset for sovereign capital preservation.
- Maximize Your Allocation to Silver (XAG) if: You want to capture high-beta upside from structural industrial growth, clean energy expansion, and a tightening supply-demand deficit. Silver offers higher potential percentage returns, though with greater price volatility.
For most diversified portfolios, a balanced strategy that pairs the monetary stability of gold with the structural upside of silver offers an effective approach to navigating the global commodities market.
References
- Belkhiria, S. (2026). The impact of tokenization on the trading process costs and carbon emission: Empirical study on the ODDO BHF Bond. Journal of Financial Innovation and Commodity Sustainability, PMC12924408. https://pmc.ncbi.nlm.nih.gov/articles/PMC12924408/
- Cerutti, E. (2026). Stablecoin Shocks and Commodity Transmission Channels. International Monetary Fund Working Papers, WP/26/44. https://www.imf.org/en/Publications/WP/Issues/2026/03/05/Stablecoin-Shocks-545220
- Hill, J. (2026). Fitting a Square Peg in a Round Hole – The Evolving Regulatory Landscape of Physical and Digital Commodities. Minnesota Journal of Law, Science & Technology, 27(1), 219–245. https://doi.org/10.24926/15529541.3919
- Liashenko, O. (2026). Precious Metals Market Maturation and Evolving Risk Profiles: A Comparative Analysis of Gold and Silver Tail Risk Dynamics. Journal of Risk and Financial Management, 5(2), 28–51. https://doi.org/10.3390/jrfm5020028
- Silver Institute. (2026). World Silver Survey 2026. Metals Focus, published April 15, 2026. https://goldsilver.com/eduhub/silver/what-silver-should-i-invest-in/