Silver Price Forecast 2026: What Investors Should Expect Next
Silver Spot~$70.38 / ozAs of mid-June 2026 (LBMA). Prices are indicative. Verify live rates before trading.
The 2026 Silver Story So Far
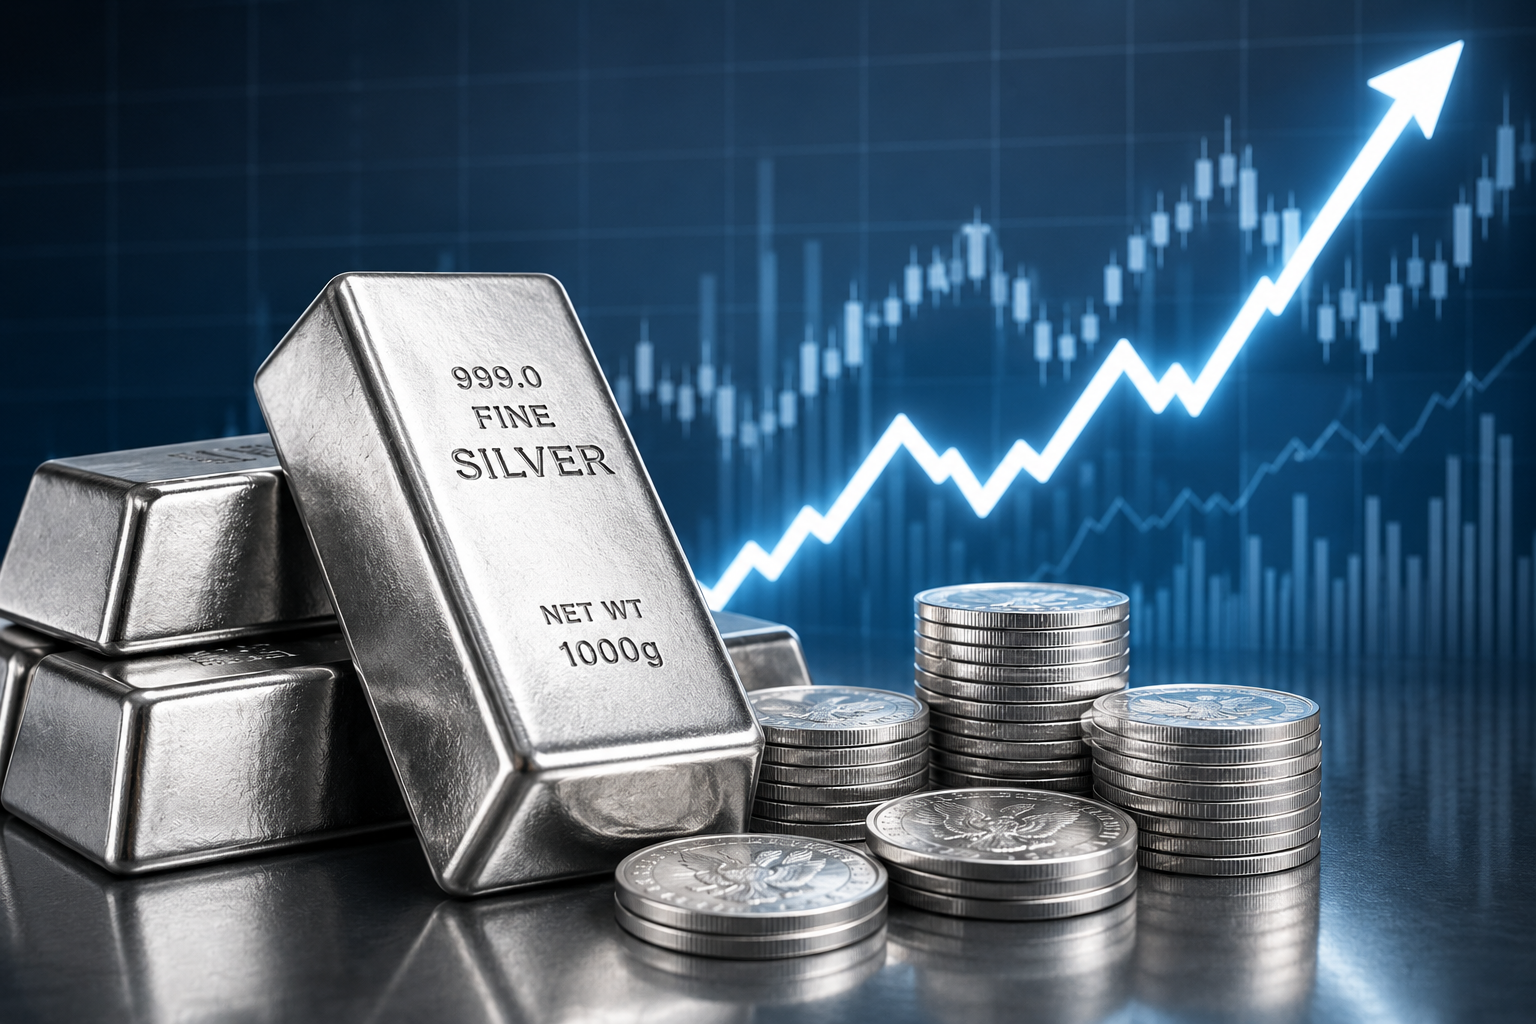
Silver entered 2026 as one of the most talked-about assets on Wall Street. After a staggering 147% gain in 2025, climbing from roughly $28.92 to over $70 per ounce, the metal set a nominal all-time high of $121.62 on January 29, 2026. The record shattered the old ceiling from the silver mania of 1980 and silenced the doubters who had spent years dismissing the metal as a relic.
Then the picture changed. On February 28, 2026, US and Israeli forces launched military strikes on Iran, triggering the most significant Middle East conflict in years. The geopolitical shock that many precious metal investors assumed would send silver higher did the opposite. Oil prices surged, the US dollar strengthened as a safe-haven currency, inflation expectations jumped, and Federal Reserve rate-cut hopes were shelved almost overnight.
Silver fell more than 40% from its January peak over the following weeks. By mid-March, it had crashed below $70. It stabilized in the $63 to $82 range through April and May as cease-fire hopes flared and faded. As of the week of June 15, a formal US-Iran ceasefire announcement sent silver climbing above $70 again, with the metal posting its first weekly gain in four weeks.
That volatility is the story of 2026 in miniature: powerful structural fundamentals pulling silver higher over the long term, but a fast-moving macro environment creating violent short-term swings that can trap unprepared investors.
Key Numbers at a Glance
All-Time High (Jan 29, 2026)
$121.62
Per troy ounce, nominal record
Current Spot (Jun 2026)
~$70
Down ~42% from ATH
JP Morgan Full-Year Avg
$81
2026 consensus forecast
LBMA Survey High
$165
Most bullish 2026 respondent
LBMA Survey Low
$42
Most bearish 2026 respondent
Supply Deficit (2026 Est.)
46.3M
Troy ounces (6th straight year)
2025 Annual Return
+147%
One of silver’s best years on record
Gold-Silver Ratio (Jun 2026)
~59:1
Down from 105:1 in April 2025
2025 to 2026: A Silver Price Timeline
The price action of the past eighteen months has been among the most dramatic in silver’s modern history. Understanding the sequence of events helps investors distinguish between structural moves and macro-driven noise.
Early 2025
Silver trades near $28 to $30
The gold-silver ratio sits near 105:1, a historically extreme reading signaling that silver is deeply undervalued relative to gold. Most analysts are bullish but expect a slow grind higher.
Mid-2025
Breakout begins
Silver clears the $35 barrier as Fed rate-cut expectations build, the US dollar weakens, and solar and EV-related industrial demand continues to accelerate. Investment flows surge into SLV and physical silver.
October 14, 2025
Previous all-time high at $55.51
Silver posts a new nominal all-time high, surpassing the 1980 Hunt Brothers peak. Retail and institutional attention intensifies dramatically.
January 29, 2026
Historic peak: $121.62 per ounce
Silver briefly trades above $121, a level that would have been considered fantasy just eighteen months earlier. The annual gain from January 2025 is over 300% at the peak. Short-sellers face massive losses.
February 28, 2026
US-Iran conflict begins
Military strikes on Iran spark an oil price surge, dollar strength, and inflation fears. Silver sells off sharply despite the conventional wisdom that geopolitical crises benefit precious metals.
March 20, 2026
Silver crashes 5% in a single session
Silver drops to $69.50, down 14% for the week, as markets price in a 50% probability of a Federal Reserve rate hike by October. Three consecutive weekly losses mark the sharpest correction of the bull market.
May 7, 2026
Silver hits $82 on Iran peace signals
Reports of a US-Iran memorandum of understanding send silver surging above $82 intraday. The gold-silver ratio falls to 59.36 as silver outperforms gold by more than 7-to-1 on the session.
June 10 to 15, 2026
Ceasefire deal announced; silver climbs
A formal US-Iran ceasefire agreement is announced, sending oil lower and easing inflation concerns. Silver rises 1.4% on the open and records its first positive week in four. The metal trades near $70 as investors reassess the Fed outlook.
Industrial Demand: The Structural Case for Silver
Unlike gold, which derives the vast majority of its value from investment and jewelry demand, silver sits at the intersection of precious metal and essential industrial material. That dual nature is what makes the long-term case for silver uniquely compelling and uniquely complex.
Solar Energy
Silver is used in the conductive paste that forms the electrical contacts on solar cells, enabling sunlight to become usable electricity. Between 2020 and 2024, silver consumption in solar panels more than doubled, rising from roughly 82 million ounces to approximately 197 million ounces, as global renewable energy capacity expanded at an unprecedented pace. By 2024, photovoltaics had become the single largest industrial application for silver, accounting for roughly 34% of all industrial silver consumption.
The picture has grown more nuanced in 2026. Solar manufacturers, squeezed by overcapacity and falling module prices, have accelerated efforts to reduce the silver intensity of their panels. Silver demand from the photovoltaic sector is expected to fall roughly 19% this year to approximately 194 million ounces. That sounds bearish until you realize the decline comes from using less silver per panel, not from fewer panels being built. Global solar capacity continues to expand by around 15% this year. The underlying demand engine has not stopped; it is simply becoming more efficient.
Furthermore, the shift from older P-type PERC solar cells to newer N-type TOPCon and heterojunction cells actually requires silver on both the front and rear of the cell, partially offsetting the efficiency gains made elsewhere.
Electric Vehicles
Each electric vehicle requires approximately 25 to 50 grams of silver across its electrical systems, including motor contacts, battery management systems, and charging infrastructure. As EV adoption continues to accelerate across the United States, Europe, and China, cumulative demand from this sector is growing steadily.
Artificial Intelligence and Data Centers
The AI infrastructure buildout has added a meaningful new demand vector for silver. Data centers require silver for printed circuit boards, connectors, and cooling systems. The explosive growth of AI model training and inference workloads is driving sustained increases in server deployments, each of which carries a meaningful silver content. Unlike photography, which was once a dominant silver end-use and has since essentially vanished, AI hardware demand shows no signs of slowing.
5G Infrastructure
Each 5G base station consumes approximately 15 to 25 grams of silver. The global rollout of 5G networks is still in its early stages in much of the developing world, representing a long-duration demand tail that analysts say is not yet fully priced into silver markets.
The Key Structural Insight
Silver’s industrial consumption hit a record 680.5 million ounces in 2024, the fourth consecutive annual record. Industrial uses now account for approximately 59% of total silver demand, up from roughly 40% two decades ago. Unlike investment demand, which can reverse quickly when sentiment shifts, industrial demand is embedded in global energy transition and technology infrastructure plans worth trillions of dollars.
Industrial Silver Demand by Sector (2024 Estimates)
Solar (Photovoltaics)~34%
Electronics & Electrical~26%
Brazing Alloys & Solders~13%
Automotive / EVs~9%
Other Industrial~18%
Supply: Why Production Cannot Keep Up
The supply side of the silver equation is where the structural bull case becomes most compelling. Unlike gold, where mines are built specifically to produce gold, approximately 72% of the world’s silver is produced as a byproduct of mining other metals, primarily copper, zinc, and lead. That means silver production decisions are largely made on the basis of base metal economics, not silver prices.
The practical consequence is that even when silver prices surge, mine supply responds slowly and incompletely. Global silver mining yields approximately 830 million ounces per year, and this output has grown at only 1 to 2% annually while industrial consumption has increased at 4 to 6% per year. The math is straightforward: the gap must be filled from above-ground stockpiles, and those stockpiles are finite.
Recycling provides only limited relief. Unlike gold, where recycling accounts for 25 to 30% of annual supply, silver recycling contributes only 15 to 18%. The reason is structural: most industrial silver uses permanently consume the metal. Silver in a solar panel is not recoverable at scale. Silver in electronics is rarely reclaimed. Silver in medical devices typically does not return to the market.
“Even with a 19% drop in solar silver usage in 2026, the silver market is heading for a sixth straight annual deficit of 46.3 million ounces.”
Metals Focus / Silver Institute, June 2026
The Silver Institute has documented supply shortfalls of approximately 195 million troy ounces in 2024 alone, the fourth consecutive year of deficit at that point. Structural constraints including declining ore grades, operational disruptions at major mines, and a limited pipeline of new projects are expected to continue limiting supply growth well into the decade. The Silver Institute projects a 200 million ounce annual deficit by 2030 if current trends continue.
The Iran War, Oil Prices, and the Fed’s Response
The single biggest macro factor shaping silver’s price in 2026 has been the US-Iran conflict that began on February 28. To understand why a war drove precious metals lower rather than higher, investors need to understand the specific transmission mechanism: oil prices, inflation, and Federal Reserve policy.
The conflict threatened the Strait of Hormuz, through which roughly 20% of global oil trade passes. Oil prices spiked on the conflict news, and sustained energy costs drove more than 60% of May’s monthly US CPI gain. Headline inflation reached 4.2% year-over-year by May 2026, the highest reading since April 2023. That directly contradicted the narrative that had powered silver’s 2025 surge: that the Federal Reserve was on a rate-cutting path.
Instead, by early June, the probability of a Federal Reserve rate hike by December 2026 had climbed above 71% according to CME FedWatch data. Higher expected rates push real yields up and make yield-bearing assets like Treasury bonds more attractive relative to silver, which pays no income. That suppressed the silver price even as the underlying industrial fundamentals remained intact.
The June ceasefire announcement between the US and Iran materially changed the outlook. Oil prices fell, inflation expectations eased, and silver posted its sharpest single-day gains in weeks. With the ceasefire holding, the Fed’s rate-hike calculus becomes murkier and the path to renewed precious metal strength becomes clearer. As HSBC analyst James Steel noted, however, investors should not expect a smooth ride: silver is likely to remain volatile through the summer as markets assess whether the ceasefire holds and what it means for the Fed’s next move.
What to Watch in the Second Half of 2026
Three factors will determine whether silver recovers toward institutional price targets: (1) whether the Iran ceasefire holds and oil prices remain subdued; (2) whether the Fed signals rate neutrality or actual cuts in late 2026; and (3) whether LBMA vault stock reports and COMEX registered silver inventory continue to decline, signaling genuine physical scarcity rather than sentiment-driven moves.
What the Major Banks and Analysts Are Forecasting
The spread of professional forecasts for silver in 2026 is wider than for almost any other major commodity, which itself tells you something important about the metal’s character. Silver is highly sensitive to both macro conditions and structural industrial dynamics, and reasonable people disagree sharply about which force will dominate.
Institution / Analyst
2026 Price Target
Stance
Key Driver Cited
J.P. Morgan Global Research
~$81 avg
Bullish
Steady industrial demand, supply deficits
LBMA Survey Consensus
$79.57 avg
Bullish
Broad analyst consensus; range $42 to $165
Bank of America
$56 avg / $65 peak*
Bullish
Dollar weakness, Fed easing
ING
$85 peak (Q2)
Neutral-Bullish
Sees tapering toward $78 by year-end
TD Securities
$80 mid-year
Cautious
Gradual decline to $70 by late 2027
Commerzbank
~$70 year-end
Neutral
Oil and inflation pressures must ease first
HSBC (James Steel)
~$70 year-end
Cautious
Deficits not enough alone for sustained rally
LBMA Most Bullish (ICBC)
$165
Very Bullish
Severe supply shortage, investment inflows
LBMA Most Bearish
$42
Bearish
Dollar strength, rate hike expectations
Robert Kiyosaki (Author)
$75+
Bullish
Dollar debasement, currency crisis
GoldSilver.com (A. Hibbard)
$175+
Very Bullish
Unpriced structural deficits, industrial demand
*Bank of America targets may reflect pre-Iran-conflict projections and have been widely revised upward since. Always verify the most current published targets.
The Gold-Silver Ratio and What It Tells Investors
The gold-silver ratio measures how many ounces of silver are required to purchase one ounce of gold. It is one of the oldest and most closely watched metrics in precious metals investing, and its movements in 2025 and 2026 have been extraordinary.
In April 2025, the ratio reached approximately 105:1, a historically extreme level that suggested silver was deeply undervalued relative to gold. Historically, when the ratio has reached these heights, it has eventually compressed sharply as silver outperforms. That is precisely what happened: as silver surged from $28 to over $121, the ratio compressed to approximately 40:1 at the January 2026 peak.
The Iran conflict reversed part of that compression. By mid-June 2026, with gold trading near $4,165 and silver near $63 to $70, the ratio had re-widened to approximately 59 to 64:1. That level sits between the historically extreme readings of 2025 and the historical average closer to 50:1, suggesting silver is neither wildly cheap nor expensive relative to gold at the moment.
If gold achieves the forecast levels of $5,500 to $6,000 that some major institutions have projected for 2026 and 2027, and the gold-silver ratio compresses back toward 50:1 or lower, the arithmetic implies silver prices well above $100. That is why ratio-watchers view the current level as a potential setup for another silver outperformance phase, particularly if the macro headwinds from the Iran conflict continue to recede.
The Bull Case vs. The Bear Case
Silver has already surged more than 147% in a single year and hit a nominal all-time high. That fact alone changes the nature of the investment proposition. Silver is no longer a cheap, overlooked metal waiting for discovery. It has already had its moment. The question is whether the structural story justifies substantially higher prices from here, or whether the easy money has been made.
The Bull Case
Six consecutive years of global supply deficits with no structural solution in sight
Industrial demand from solar, EVs, AI, and 5G is embedded in multi-trillion-dollar infrastructure plans
COMEX registered silver inventories have been declining as above-ground stockpiles are drawn down
The gold-silver ratio at 59 to 64:1 still implies meaningful upside if gold continues its bull market
Iran ceasefire reduces oil-driven inflation pressure and reopens the Fed rate-cut debate
De-dollarization globally and continued central bank gold buying provide a supportive monetary backdrop
US reclassification of silver as a critical material signals potential government support for domestic supply
Silver has historically outperformed gold in the later stages of precious metal bull markets
The Bear Case
May 2026 CPI at 4.2% year-over-year leaves the Fed with little room to cut rates
A probability above 70% of a December 2026 rate hike could sustain dollar strength and pressure silver
Solar PV manufacturers are accelerating silver substitution; further thrifting reduces structural demand
Silver is down more than 40% from its January high; technical damage could take months to repair
Investment demand has softened significantly since the January 2026 peak
At $70 per ounce, silver is no longer historically cheap, reducing the margin of safety for new investors
The Iran ceasefire remains fragile; any re-escalation would likely revive oil and dollar strength
HSBC notes that moderating deficits alone are not sufficient to drive sustained silver price appreciation
How US Investors Can Gain Silver Exposure
For American investors considering adding silver to a portfolio, there are several approaches, each with distinct risk and return characteristics. The right choice depends on your investment horizon, risk tolerance, and whether you view silver primarily as a monetary hedge or an industrial commodity play.
Physical Silver
Buying physical silver in the form of coins, bars, or rounds gives you direct ownership of the metal. American Silver Eagle coins from the US Mint are the most widely recognized and liquid physical silver product in the United States. Physical silver eliminates counterparty risk but introduces storage and insurance costs, and wide dealer premiums over spot can eat into returns at current elevated price levels.
Silver ETFs
The iShares Silver Trust (SLV) and the Aberdeen Physical Silver Shares ETF (SIVR) are the largest US-listed silver ETFs backed by physical silver held in London vaults. They provide liquid, cost-efficient exposure without the logistics of physical storage. The SLV experienced significant net flow volatility from late 2025 through May 2026, reflecting the sharp swings in investor sentiment.
Silver Mining Stocks and ETFs
Silver mining companies provide leveraged exposure to the silver price: when silver rises, miners’ profit margins typically expand more than proportionally, leading to outsized stock gains. The Global X Silver Miners ETF (SIL) and the First Trust ISE Global Silver Index Fund (SILJ, focused on junior miners) are the most widely traded vehicles in this category. Mining stocks carry operational risks including project delays, cost overruns, jurisdiction risk, and management execution, in addition to the silver price itself.
Silver Streaming Companies
Companies like Wheaton Precious Metals and Royal Gold provide financing to mining operations in exchange for the right to purchase a portion of future silver and gold production at fixed, below-market prices. Streamers offer lower operational risk than direct mining companies while still providing meaningful leverage to silver prices.
Silver Futures and Options
CME Group silver futures (ticker: SI) allow sophisticated investors to take long or short positions on silver with significant leverage. Options on silver futures provide strategies for hedging existing positions or expressing directional views with defined risk. These instruments are not appropriate for most retail investors given the leverage and complexity involved.
Important Reminder
This article is for informational purposes only and does not constitute investment advice. Silver is a highly volatile asset. Past performance, including the 147% gain in 2025, is not indicative of future results. Always consult a qualified financial advisor before making investment decisions.
Frequently Asked Questions
Will silver reach $100 per ounce again in 2026?
It is possible but not the base case for most institutional analysts. J.P. Morgan and the LBMA consensus forecast a 2026 average near $79 to $81 per ounce. More bullish analysts at ICBC Standard Bank and GoldSilver.com see a path to $100 and beyond if the Iran ceasefire holds, inflation cools, and the Fed signals easier monetary policy. The wide range of forecasts, from $42 to $165, reflects genuine disagreement about which macro scenario will dominate in the second half of the year.
Why did silver fall after hitting an all-time high?
The US-Iran military conflict that began February 28, 2026, sent oil prices surging, reignited inflation fears, and essentially eliminated near-term Federal Reserve rate-cut hopes. A higher-for-longer or potentially rising rate environment is a headwind for silver because the metal pays no income, making yield-bearing alternatives more attractive. The dollar also strengthened on safe-haven flows, which historically pressures dollar-denominated commodities like silver.
Is silver still in a structural supply deficit?
Yes. Despite a roughly 19% decline in solar-related silver demand due to thrifting in panel manufacturing, the silver market is on track for its sixth consecutive annual supply deficit in 2026, totaling an estimated 46.3 million ounces. Total global mining output cannot keep pace with industrial consumption, and recycling rates remain insufficient to bridge the gap.
What is the gold-silver ratio telling investors right now?
At approximately 59 to 64:1 in mid-June 2026, the ratio has compressed dramatically from the historically extreme 105:1 seen in April 2025, but it remains above the long-run historical average closer to 50:1. Many precious metal investors view ratios above 60:1 as a signal that silver is undervalued relative to gold, particularly if gold continues its own bull market driven by central bank buying and de-dollarization trends.
How does the Iran ceasefire affect the silver outlook?
If the ceasefire holds and oil prices remain subdued, the direct inflationary pressure from energy costs would ease. Lower oil means lower CPI, which would reduce the Fed’s justification for further rate hikes and potentially reopen the door to rate cuts in 2027. That monetary easing scenario is broadly positive for silver. However, analysts caution that the ceasefire remains fragile, and any re-escalation would likely revive the oil-inflation-dollar dynamic that pressured silver throughout the spring.
Is now a good time to buy silver?
Whether the current price represents a buying opportunity depends entirely on your time horizon, risk tolerance, and existing portfolio exposure. Silver at approximately $70 per ounce is still some 42% below its January 2026 all-time high but nearly 150% above where it traded eighteen months ago. Institutional forecasts averaging $79 to $81 suggest modest upside from current levels on a full-year basis. Long-term structural bulls point to multi-year supply deficits and accelerating industrial demand. The near-term path depends heavily on macro factors, particularly the Iran ceasefire durability and Federal Reserve policy signals. This is not investment advice. Consult a qualified financial professional.
The Bottom Line
Silver’s story in 2026 is not simple, and any investor or analyst who presents it as such is not giving you the full picture. On one hand, the structural case is as strong as it has ever been. Six consecutive years of supply deficits. Record industrial consumption. A global energy transition and AI infrastructure buildout that require silver in ways that are not easily substituted. A monetary backdrop that has shifted meaningfully in silver’s favor over the past two years.
On the other hand, the near-term macro environment has thrown a major curveball. The US-Iran conflict triggered a sequence of oil price surges, inflation spikes, and Fed hawkishness that sent silver from $121 to below $70 in a matter of weeks. That kind of drawdown is painful for anyone who bought near the top and serves as a useful reminder that silver is genuinely volatile, far more so than gold.
The June 2026 ceasefire announcement has improved the near-term outlook, with inflation expectations easing and the path to a more accommodative Fed reopening. Most major institutions continue to forecast full-year 2026 silver averages in the $79 to $81 range, meaningfully above where the metal currently trades. That implies additional upside ahead if macro conditions cooperate.
What investors should expect next is more of what 2026 has already delivered: significant volatility driven by geopolitical developments, Federal Reserve signaling, and oil price moves, punctuated by structural demand data and physical market signals that continue to point toward a higher price over time. Silver rewards patience and punishes leverage. Investors who understand both sides of that equation are the ones best positioned to benefit from whatever comes next.
“The structural case, supply deficits, industrial demand, and monetary tailwinds, remains valid. But silver is no longer historically cheap. It demands a long-term view and tolerance for volatility.”
GoldSilver.com / April 2026 Analysis
Editorial Disclosure: This article is produced for informational and educational purposes only. It does not constitute investment advice, a solicitation, or a recommendation to buy or sell any security or financial instrument. Silver and other precious metals carry significant price risk. The forecast data referenced in this article is sourced from publicly available institutional research as of June 2026. Forecasts are subject to change. Past performance is not a guarantee of future results. Always consult a registered financial advisor before making investment decisions. Sources cited include J.P. Morgan Global Research, the London Bullion Market Association (LBMA), the Silver Institute, Metals Focus, Bank of America Global Research, ING Economics, HSBC Global Research, CME Group FedWatch, and the Bureau of Labor Statistics.