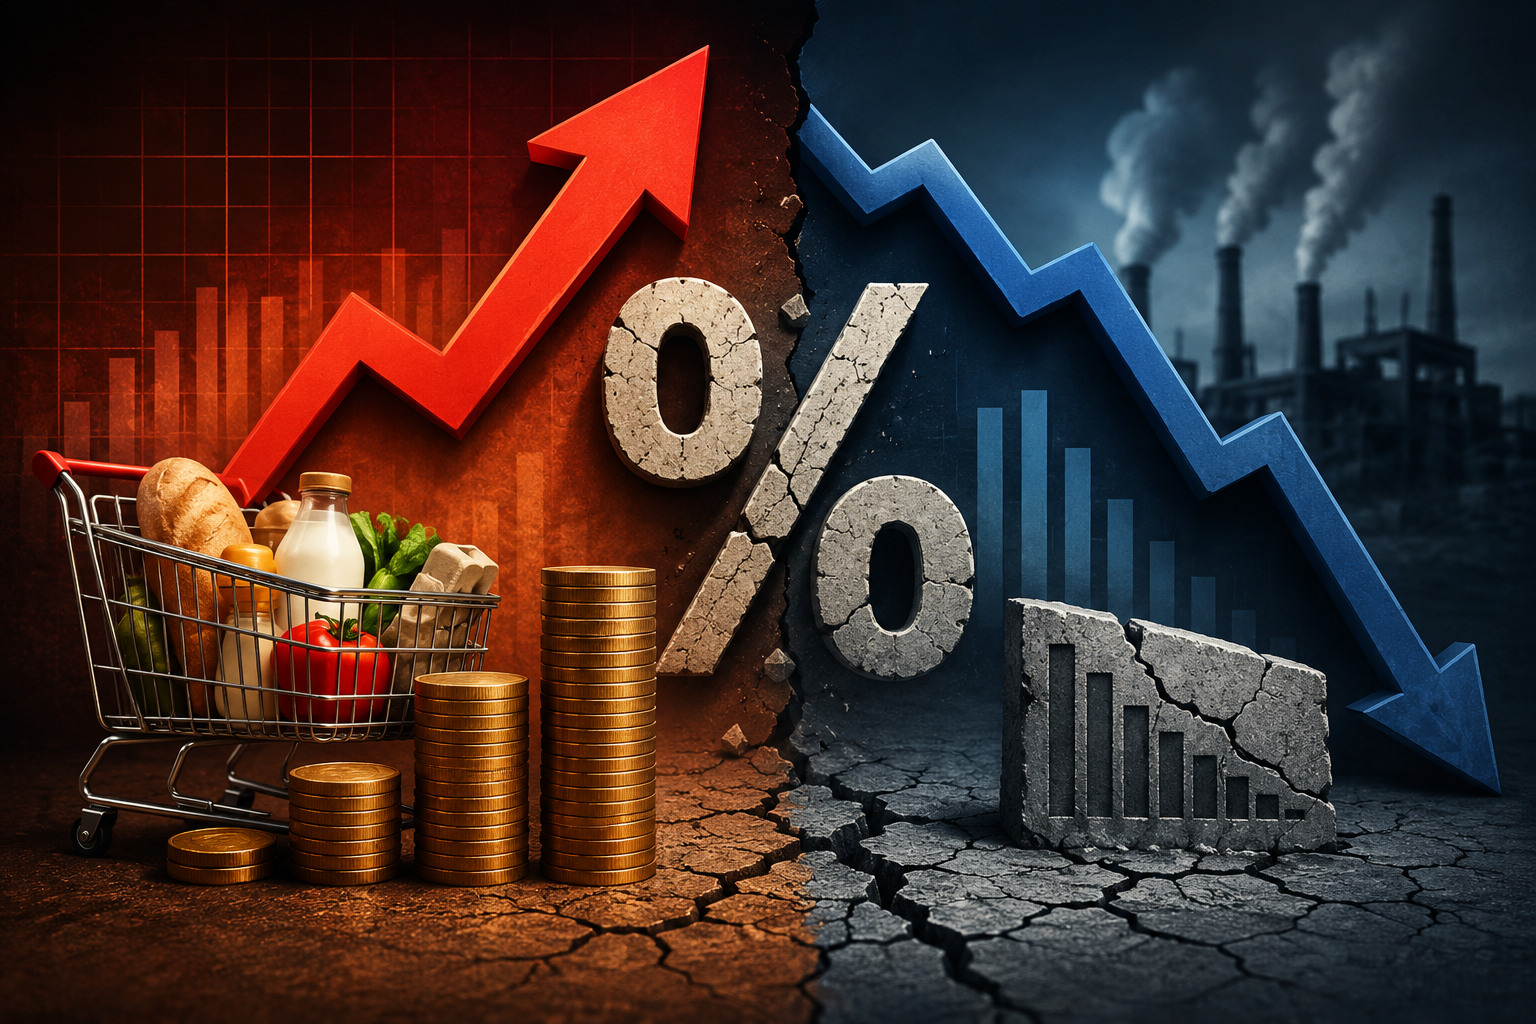
When prices rise, a healthy economy usually features plenty of job openings and strong wage growth to match. When the economy slows down, prices typically cool off, offering consumers financial relief.
However, there is a rare economic anomaly where the worst aspects of both cycles collide simultaneously. This condition is known as stagflation.
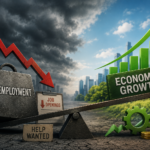
Stagflation occurs when stagnant economic growth, high unemployment, and stubborn price inflation take hold at the same time. This comprehensive guide reviews how stagflation happens, examines the historical milestones that define it, analyzes the macroeconomic risks of 2026, and provides strategic frameworks for individual financial planning.
1. Deconstructing Stagflation: The Economic Toxic Mix
The term stagflation was popularized in the late 1960s by British politician Iain Macleod during a speech to the House of Commons. It describes an economic environment that breaks standard Keynesian macroeconomic models, which historically assumed that inflation and economic stagnation could not coexist over an extended timeline.
The Three Structural Pillars of Stagflation
Stagnant Economic Growth: Gross Domestic Product (GDP) slows to a crawl or contracts entirely, indicating that business investment, industrial output, and consumer retail sales have stalled.
Elevated Inflation: The consumer price index moves significantly above target boundaries, eroding domestic purchasing power day by day.
High Unemployment: Companies cut down operating expenses by freezing hiring processes, reducing employee hours, or initiating massive workforce layoffs.
The Misery Index Indicator
Economists often monitor this economic phenomenon using the Misery Index. Created by Arthur Okun, this simple metric adds the annual inflation rate directly to the seasonally adjusted unemployment rate.
When the index crosses into double digits, it points to severe systemic stress for everyday households, as their cost of living increases at the exact moment their income security declines.
2. What Triggers a Stagflationary Crisis?
Stagflation does not develop overnight through typical domestic business cycles. It is usually sparked by two specific, overlapping catalysts.
Supply Side Shocks
The most frequent trigger for stagflation is a sudden, unexpected drop in the supply of an essential economic commodity. If the availability of crude oil, natural gas, agricultural fertilizer, or semiconductor chips drops sharply, the cost of manufacturing and shipping goods climbs instantly.
Because businesses cannot easily replace these core inputs, they must increase retail consumer prices to protect their profit margins. This drives cost push inflation upward even as production output falls, causing an immediate slowdown in broader economic activity.
Conflicting Monetary and Fiscal Policies
Stagflation can be worsened by contradictory policy decisions from governments and central banks. For example, if a government runs large fiscal deficits and injects liquidity into the private sector while industrial production capacity is falling, it creates excess aggregate demand.
If the central bank keeps interest rates too low for too long to preserve employment, it can anchor inflation expectations at elevated levels. This results in an oversupply of money chasing a shrinking pool of physical goods.
3. Current Context: Global Stagflation Pressures in 2026
Global economic data highlights a noticeable return of stagflationary dynamics, keeping monetary policymakers and international institutions on high alert.
Key International Reports and Downgrades
In June 2026, the World Bank officially lowered its global economic growth forecast for the year to 2.5%, down from the 2.9% expansion observed in 2025. This downgrade represents the weakest pace of global economic output since the pandemic period.
The slowdown stems primarily from major geopolitical conflicts in the Middle East that have disrupted shipping corridors through the Strait of Hormuz. These disruptions caused global commodity and energy prices to spike by 22% compared to early year baselines.
Concurrently, institutional research from investment firms like Franklin Templeton warns that the global macroeconomic backdrop is shifting toward a stagflationary environment. While technology infrastructure spending and artificial intelligence software adoption provide some support for corporate productivity, the high capital costs required for advanced chip hardware and data center power grids have added fresh demand pull inflation to a market already managing energy supply shocks.
Divergent Pressures in Key Regions
United States: The Consumer Price Index (CPI) has moved closer to 4.2%, well above the Federal Reserve’s long term 2% target. Consumer retail spending has softened under the pressure of weaker real disposable incomes, while corporate credit demands remain high due to ongoing investments in AI infrastructure.
Eurozone: Europe is navigating an energy market shock that echoes the structural vulnerabilities seen in 2022. Though alternative energy integration has improved supply security, underlying core inflation figures are expected to climb past 3%, prompting the European Central Bank to continue tightening policy despite sluggish domestic GDP growth.
Developing Economies: The World Bank notes that nearly one quarter of all emerging market and developing economies will remain poorer on a per capita income basis than they were in 2019, turning the 2020s into a very challenging decade for global wealth convergence.
Economic Region
2026 Expected Real GDP Growth
Tracing Annual Inflation Rate
Core Structural Headwinds
Global Economy
2.5% (World Bank)
4.0% Projected Average
Shipping disruptions, commodity shocks
United States
Subdued Trend Momentum
4.2% Trailing Metric
Real wage compression, infrastructure costs
Eurozone
Sluggish Expansion
3.0%+ Near Term Projection
Import price volatility, manufacturing drag
4. Interactive Tool: The Stagflation Risk Calculator
To understand how global oil prices, consumer demand adjustments, and monetary policies interact, use the simulator below. Adjust the core parameters to see how supply shocks can alter the path of unemployment and inflation.
Interactive Stagflation Risk Calculator
Simulate structural macroeconomic trade-offs. Adjust the exogenous energy price premium alongside the central bank’s interest rate defense framework to visualize how supply-side pressures alter trailing consumer inflation, labor markets, and the overall Misery Index metric.
Projected Inflation
4.00%
Elevated Pressures
Unemployment Rate
4.30%
Softening Output
The Misery Index
8.30
Stagflation Warning
Exogenous Energy Price Premium(Supply-Side Shock)+20%
0% Baseline Stable Markets50% Severe Supply Disruption
Central Bank Interest Rate Position(Monetary Policy Lever)3.75%
5. Lessons from the Past: The 1970s Stagflation Crisis
To understand why stagflation is so challenging for policymakers, it helps to examine the historical precedent of the 1970s. For decades after World War II, the global economy relied on the Philips Curve, an economic model showing an inverse relationship between inflation and unemployment. The 1970s broke that model entirely.
The Double Oil Shocks
Two major supply shocks disrupted the global economy during this decade. The 1973 OPEC oil embargo sent crude oil prices climbing from 3 dollars per barrel to nearly 12 dollars globally. This was followed in 1979 by the Iranian Revolution, which disrupted production pipelines and doubled oil prices again.
Because petroleum is a critical component for transportation, plastic manufacturing, and industrial farming, production costs spiked globally. This caused a sharp drop in economic growth and pushed consumer prices to historic highs.
The Policy Mistake: Stop Go Monetary Cycles
The Federal Reserve, led at the time by Arthur Burns, attempted to balance conflicting priorities by alternating its strategy. When unemployment rose, the Fed lowered interest rates to boost the economy. As soon as inflation flared back up, they raised rates to cool demand.
This stop go monetary policy confused businesses and consumers, causing long term inflation expectations to unanchor. Companies and labor unions began building automated annual price hikes and wage increases directly into their long term contracts, creating a self sustaining wage price spiral.
Breaking the Cycle: The Volcker Shock
The cycle was finally broken in 1979 when Paul Volcker took over as Chair of the Federal Reserve. Volcker decided that lowering inflation had to be the absolute priority, even if it caused short term economic pain.
The Fed pushed the benchmark federal funds rate to an unprecedented peak of 20% in 1981. This policy caused a severe double dip recession and pushed unemployment past 10%. However, the aggressive strategy successfully broke the wage price spiral, brought inflation down from 14% to under 4%, and re anchored long term market expectations for the next several decades.
6. Why Stagflation is a Policy Nightmare
Stagflation creates a difficult dilemma for central banks because the standard tools used to solve one economic problem often worsen another.
The Central Bank Dilemma
When managing a standard economic slowdown, central banks typically lower benchmark interest rates to make credit cheaper. This encourages corporate expansion and consumer spending, which helps lower unemployment. However, if a central bank cuts rates during a stagflationary period, that extra liquidity can accelerate inflation.
Conversely, if a central bank raises interest rates to combat high inflation, it increases the cost of mortgages, business lines of credit, and consumer loans. While this cools demand and lowers prices, it also slows down business investment and can push unemployment even higher.
The Fiscal Policy Bind
Governments face similar challenges with fiscal policy. Traditional economic playbooks suggest running budget deficits and increasing public spending during a recession to support households. However, in a stagflationary environment, adding government spending without an equivalent increase in supply can drive consumer price inflation higher.
7. Strategic Playbook: How Investors Can Survive Stagflation
A stagflationary environment requires a different financial approach than a typical growth cycle. When cash is losing purchasing power and corporate profit margins are under pressure from rising input costs, asset allocation requires careful positioning.
Resilient Asset Classes
Commodities and Energy Resources: Tangible assets like crude oil, natural gas, agricultural goods, and precious metals often perform well during stagflation because their price increases are what drive the inflation shock in the first place.
Treasury Inflation Protected Securities (TIPS): These specialized government bonds adjust their principal value automatically based on changes in the Consumer Price Index, protecting the investor's underlying purchasing power.
Companies with Strong Pricing Power: Businesses that provide essential utilities, healthcare infrastructure, or irreplaceable consumer staples can pass higher input costs directly to consumers without seeing a sharp drop in transaction volume.
Vulnerable Asset Classes to Approach with Caution
Growth Equities with High Leverage: Tech firms and startups reliant on cheap debt to fund future growth face challenges when high interest rates increase debt servicing costs and lower the present value of future earnings.
Long Term Fixed Income Securities: Standard long term bonds with fixed yields lose value when inflation rates exceed their nominal return, leading to negative real yields for investors.
Cyclical Consumer Discretionary Stocks: Companies that depend on discretionary consumer spending, such as luxury retail brands, high end travel services, and entertainment providers, often see declining revenues as households prioritize basic necessities like food and utilities.
For primary economic data and ongoing research on global growth updates, readers can review reports directly from the World Bank Global Economic Prospects portal or track regional updates from the European Central Bank. Monitoring these macroeconomic trends helps individuals and businesses protect their portfolios and adapt to shifting economic climates.