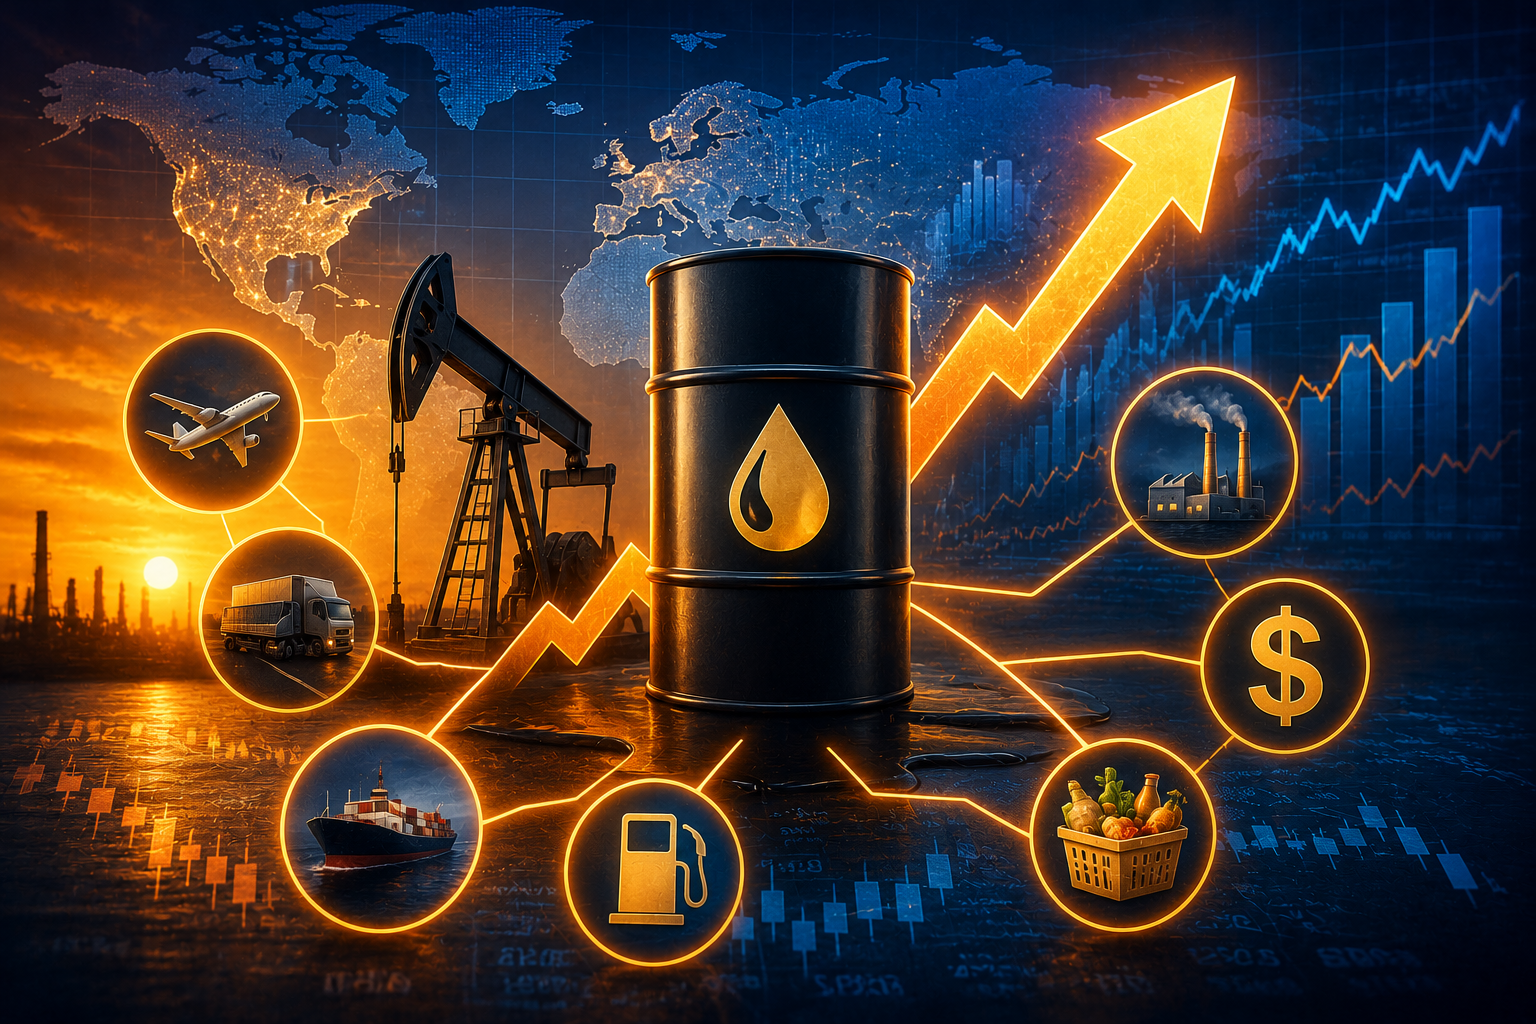
The Economics of Energy: How Oil Prices Impact Everything | 2026 Analysis
From the gas pump to the grocery store, from airline tickets to your mortgage rate, oil sits beneath nearly every price in the American economy. A sweeping 2026 investigation of what crude oil really costs us.
Updated: June 2026
Read Time: ~20 min
Sources: EIA, IEA, Federal Reserve, Deloitte, J.P. Morgan, RBC Economics
2026 Crisis Data
Iran War Impact
!
Breaking: The 2026 Oil Crisis
U.S. and Israeli air strikes on Iran on February 28, 2026 triggered the largest supply disruption in the history of the global oil market, according to the International Energy Agency. Brent crude soared within range of $120 per barrel, diesel prices jumped 23% in two weeks, and gasoline approached $4 per gallon nationally. The economic shockwaves are still unfolding. This article covers both the long-run mechanics of oil pricing and the fast-moving 2026 crisis in real time.
$120Brent crude peak (near), March 2026 ($/bbl)
+42%U.S. oil price rise from pre-war levels by March 2026
$4.65U.S. average diesel price per gallon, March 2026
+0.75ppEstimated inflation increase if conflict persists 1 year
Oil is not merely an energy commodity. It is the circulatory system of modern economic life. When its price moves, virtually every sector of the economy feels it, often within days.
Crude oil powers the trucks that move your groceries, the factories that manufacture your appliances, the planes that carry travelers, the machines that harvest your food, and the furnaces that heat millions of American homes. It is a feedstock for plastics, chemicals, fertilizers, medicines, and synthetic fabrics. Crude oil is so deeply embedded in the American industrial and consumption system that a meaningful price shift in the energy market is, by definition, a meaningful shift in the broader economy.
Energy costs account for 6.4 percent of the headline Consumer Price Index calculation. Gasoline alone is so influential that a 20 percent surge in pump prices can visibly move overall inflation readings, even when underlying core trends remain stable. This is not a theoretical relationship. It plays out, with remarkable consistency, every single time oil prices spike or collapse.
The United States has become the world’s largest crude oil producer, which creates a more complex relationship with oil prices than existed in previous decades. American consumers and households suffer when prices rise. But American oil companies, investors, and energy-producing states benefit significantly. Energy companies in the S&P 1500 added roughly $475 billion in market capitalization in the early weeks of the 2026 crisis alone. This duality makes oil economics uniquely contentious and uniquely important to understand.
i
The Duality of American Oil
The U.S. is simultaneously the world’s largest oil producer and one of its largest consumers. This means a price spike creates winners (oil companies, stockholders, energy-state economies) and losers (households, transportation-dependent businesses, manufacturers) at the same time.
Section 02
How Oil Prices Are Set: Supply, Demand, and Geopolitics
The price of crude oil is set through a complex interplay of global supply and demand, OPEC production decisions, geopolitical risk premiums, currency movements, speculative investment flows, and strategic reserve policy. No single actor controls it. But a few actors exert outsized influence.
The Major Price Drivers
OPEC and OPEC+ production decisions remain the most powerful single lever in global oil markets. When OPEC nations agree to cut production, global supply tightens and prices rise. When they open the taps, prices fall. Saudi Arabia, as the world’s largest oil exporter, carries decisive influence within this cartel.
U.S. shale production has fundamentally changed the calculus since the mid-2010s. With WTI breakeven costs for new wells ranging from $61 to $70 per barrel in 2026, American producers can ramp up drilling rapidly when prices rise but pull back sharply when prices fall. This creates a natural ceiling on how high prices can stay before domestic supply floods the market.
Geopolitical disruptions are the wild card. Wars, sanctions, regime changes, and infrastructure attacks can remove millions of barrels per day from global supply almost overnight. The 2026 Iran conflict demonstrated this with particular force: the closure of the Strait of Hormuz, through which roughly 20 percent of the world’s oil flows, sent Brent futures soaring within a whisker of $120 per barrel within days of the initial strikes.
The U.S. dollar plays a crucial structural role. Because oil is priced in dollars globally, a stronger dollar makes oil more expensive for buyers using other currencies, which suppresses demand. A weaker dollar has the opposite effect. This creates a perpetual feedback loop between Federal Reserve monetary policy and global energy markets.
Sources: U.S. Energy Information Administration (EIA), J.P. Morgan Global Research, IEA 2026
Section 03
Impact at the Gas Pump: The Most Visible Pain Point
For most Americans, oil prices first register as a number on a gas station sign. That number has enormous psychological and practical power over household budgets and consumer confidence.
The relationship between crude oil and pump prices is direct but not instantaneous. As crude oil is the largest single driver of the final pump price, typically representing over half of each gallon’s cost, a rise in crude oil costs translates quickly to higher gasoline prices. For every $10 increase in the price of oil, gasoline prices rise by roughly 30 cents per gallon, according to RBC Economics.
The asymmetry of this relationship is well documented and widely resented. When oil prices rise, gasoline prices tend to jump upward quickly. When oil prices fall, pump prices tend to drift downward much more slowly, a pattern economists call “rockets and feathers.” Retailers are often reluctant to cut prices rapidly because they have existing inventory purchased at higher costs, and because the asymmetry itself is partially profitable.
The 2026 Pump Price Shock
In early January 2026, the national average gasoline price was $2.81 per gallon. By mid-March, following the outbreak of the Iran conflict and resulting Strait of Hormuz disruptions, that average had climbed past $3.98 per gallon. California drivers were paying $5.62 per gallon. Even typically low-cost states like Oklahoma and Kansas rose above $3.20 per gallon. The U.S. Energy Information Administration projected gasoline could average $3.34 per gallon for all of 2026, a sharp upward revision from the $2.91 forecast made in February before the conflict began.
For a household driving 12,000 miles per year at average fuel economy, even a $0.80 per gallon increase represents hundreds of dollars in lost annual purchasing power. Multiplied across 130 million American households, the economic drag from gasoline alone becomes significant within weeks of a sustained spike.
U.S. Average Gasoline Prices by State Category (March 2026, $/gallon)
California (highest)
$5.62
West Coast avg.
$4.85
National average
$3.98
Midwest avg.
$3.48
Oklahoma / Kansas (low)
$3.22
Pre-war national avg. (Jan 2026)
$2.81
Source: AAA, EIA, TheStreet (March 2026)
!
The $150 Billion Consumer Drag
RBC Economics estimated that a WTI price at $100 per barrel in 2026, up roughly $40 from February baselines, would mean a $1.20 per gallon increase in gasoline, translating to a nominal consumer spending hit of $50 to $150 billion for the year depending on where oil ultimately settles.
Section 04
Oil, Inflation, and the Federal Reserve
The relationship between oil prices and broader inflation is one of the most intensely studied topics in monetary economics. The basic mechanics are well established: energy is an input to nearly everything, so higher energy costs ripple through the price of goods and services across the entire economy.
Headline consumer inflation had been cooling steadily from its 9.1 percent peak in June 2022, falling to 2.4 percent by January 2026. Then the oil shock hit. Year-over-year inflation as measured by the PCE price index jumped from 2.9 percent in February to 3.8 percent in April 2026, driven primarily by substantial energy price increases.
Goldman Sachs economists have warned that energy costs make up 6.4 percent of the headline CPI calculation, meaning sustained high oil prices can visibly push overall inflation readings higher. Deloitte Insights estimated that if the Middle East conflict persists for a year, inflation would likely rise by at least 0.75 percentage points from pre-war levels. When second-round effects, meaning inflation expectations becoming entrenched in wage negotiations and supply contracts, are added to that calculation, some estimates suggest the inflationary impact could be substantially higher.
The Federal Reserve’s Impossible Position
The Fed’s dilemma in an oil shock is structural. Higher oil prices cause inflation, which would normally call for higher interest rates to cool demand. But the same oil price spike also suppresses real consumer spending, slows growth, and could accelerate unemployment. Raising rates into that environment risks pushing a weakening economy into recession. Cutting rates risks letting inflation run hotter.
The Federal Reserve Bank of Boston noted in its May 2026 assessment that two structural changes to the U.S. economy may cushion the impact of the current shock compared to the 1970s: the substantial increase in domestic oil production and the declining share of household budgets devoted to energy. But those cushions are partial, not complete. The Fed remained in “wait and see” mode through 2026, as RBC Economics noted: higher oil prices solidify the view that the central bank cannot meaningfully lower inflation resulting from higher commodity prices through monetary policy alone.
U.S. Headline Inflation (CPI, Year-over-Year %) vs. Oil Price Shocks
Sources: Bureau of Labor Statistics, Federal Reserve Bank of Boston, Deloitte Insights 2026
“The longer this lasts, the more significant the shock would be.”
Gregory Daco, Chief Economist, EY-Parthenon (March 2026)
Section 05
Groceries and the Food Supply Chain
You do not need to own a car to feel the economic pain of rising oil prices. The food supply chain is saturated with energy costs at every link.
David Ortega, food economist and professor at Michigan State University, put it plainly: diesel fuel is critical up and down the food supply chain. Tractors run on diesel. The vast majority of food transported across the United States moves on trucks. Refrigerated storage facilities run on electricity, largely generated from fossil fuels. The fertilizers that make large-scale agriculture possible are derived primarily from natural gas, which often tracks crude oil prices in the broader energy market.
Concerns over grocery prices topped the list of consumer worries in Morning Consult polling in 2023, 2024, and 2025, ahead of housing and inflation generally. In 2026, the oil shock has intensified that pressure. The U.S. Department of Agriculture’s latest report shows “food at home” prices are expected to increase 3.1 percent in 2026, nearly double the USDA’s projection at the start of the year, with at least part of the increase attributable to the conflict in the Middle East and the resulting spike in energy costs.
That said, the transmission from oil prices to grocery prices is not immediate. Direct energy costs account for only about three cents of every food dollar, according to the USDA. But those three cents are just the beginning. Transportation, storage, processing, and packaging all embed energy costs indirectly, and those pass-throughs tend to appear gradually over months. As one Moody’s supply chain analyst noted: “Price increases tend to be gradual and are usually triggered by a determination that cost increases will stick.”
3 cents
Direct Energy Share of Every Food Dollar
But indirect energy costs in transport, storage, and processing are substantially larger and take months to show up fully in grocery prices.
+3.1%
USDA 2026 Food-at-Home Price Forecast
Nearly double the forecast made at the start of 2026. The Iran conflict and energy spike are a primary driver of the upward revision.
+0.4%
Grocery Price Rise, Jan-Feb 2026
Grocery prices rose 0.4 percent from January to February alone, putting them 2.4 percent above year-ago levels before the oil shock fully filtered through.
Months
Typical Lag Time to Full Pass-Through
Rising oil costs take months to fully filter into grocery bills, but once producers determine that higher costs are permanent, the price increases follow.
Section 06
Airlines and Transportation: The Most Oil-Exposed Industries
No major U.S. industry is more directly exposed to crude oil prices than aviation. Jet fuel is typically the single largest operating cost for airlines, and unlike trucking companies that can hedge fuel costs or pass them through in freight rates, airlines compete intensely on price in a market where customers have strong alternatives.
Jet fuel went from $99 per metric ton on February 27, 2026, to $197 per metric ton by March 20, according to data from the International Air Transport Association. That near-doubling in the cost of one of aviation’s primary inputs unfolded over fewer than three weeks. Scott Kirby, CEO of United Airlines, told ABC News in March that ticket prices might have to rise by about 20 percent to help cope with the soaring cost of fuel, and that his airline’s plans assume oil reaches $175 per barrel and does not return to $100 per barrel until the end of 2027. Already, Forbes found that airfare for the summer 2026 travel season had risen 17 percent.
!
Airline Fuel Shock: 2026 Numbers
Jet fuel doubled from $99 to $197 per metric ton in less than three weeks following U.S. and Israeli strikes on Iran. United Airlines CEO warned ticket prices may need to rise 20 percent. Summer airfare was already up 17 percent from year-ago levels by April 2026.
The impact extends far beyond airfare. The ripple effects into tourism, business travel, hotel occupancy, and convention industries are significant. Oxford Economics forecast that 2026 will bring the slowest annual consumer consumption growth since 2013, excluding the pandemic year, with rising gasoline prices more than offsetting the boost that higher tax refunds had been expected to provide.
Trucking, the backbone of American commerce, faces parallel pressure. Diesel prices at $4.65 per gallon in March 2026, a 23 percent jump from pre-war levels, directly raise the cost of every product moved by truck, which means virtually every product moved in the United States. Small trucking operators with thinner margins and less hedging capacity face existential pressure when diesel prices spike this rapidly.
Section 07
Manufacturing, Chemicals, and Industrial America
Crude oil is not only burned for energy. It is a raw material for an enormous range of manufactured products. Plastics, synthetic fabrics, pharmaceuticals, fertilizers, pesticides, adhesives, cleaning products, and packaging materials all trace their origins, in whole or in part, to petroleum derivatives. This means that a sustained rise in crude oil prices raises input costs across the manufacturing sector even for industries with no direct fuel consumption.
Plastics and Chemicals
Petrochemicals are the building block of modern manufacturing. Higher crude raises feedstock costs for everything from packaging to medical supplies. Lower oil helps margins but correlates with weaker industrial demand.
High Cost Sensitivity
Agriculture and Fertilizer
Natural gas, which tracks oil in energy markets, is the primary feedstock for nitrogen fertilizers. Higher energy prices raise production costs for farmers, compounding food inflation downstream.
Direct Pass-Through
Construction
Construction is energy-intensive. Heavy equipment runs on diesel. Asphalt is derived from crude oil. Steel and cement production are energy-heavy. Higher oil raises material and equipment costs across every building project.
Multiple Channels
Energy Sector Itself
Higher prices are a windfall for oil and gas producers. Exploration, drilling, and production increase when prices justify the investment. But breakeven costs for new U.S. wells range from $61 to $70 per barrel, limiting the response at lower price levels.
Sector Winner
Shipping and Logistics
Bunker fuel for ocean shipping and diesel for last-mile delivery logistics both rise with crude. This raises import and export costs, with particular impact on trade-sensitive industries.
High Exposure
Utilities and Electricity
While the U.S. power grid is increasingly driven by natural gas rather than oil, energy-market co-movement still transmits oil price pressure into electricity generation costs, particularly in peak demand periods.
Indirect Exposure
The downstream manufacturing sector faces a complicated picture in 2026 specifically. Lower crude costs earlier in 2025 had been improving refining margins and petrochemical feedstock economics. The sudden reversal from the Iran war has compressed those margins sharply. For petrochemical companies, higher oil prices reduce profit margins both by raising feedstock costs and, if sustained, by weakening the broader industrial demand that underpins their end markets.
Section 08
Housing and Interest Rates: The Indirect Channel
The connection between oil prices and the housing market is indirect but powerful, operating primarily through the inflation and interest rate channel. When oil prices drive inflation higher, the Federal Reserve is pressured to maintain higher interest rates for longer. Higher interest rates mean higher mortgage rates, which reduce housing affordability and cool residential construction and sales activity.
Deloitte Insights noted explicitly that higher interest rates following an oil price spike weigh on interest-sensitive sectors such as durable goods consumption, housing, and residential investment by raising the cost of debt servicing. This is the mechanism by which an oil shock in the Middle East can slow home sales in suburban Ohio: higher crude leads to higher inflation, which leads the Fed to hold rates elevated, which leads mortgage lenders to raise the cost of borrowing, which leads homebuyers to pull back.
The housing market entered 2026 already strained by elevated mortgage rates following the post-pandemic inflation cycle. The 2026 oil shock and its inflationary effects have introduced fresh uncertainty into an already fragile recovery in residential real estate activity. Builders face higher material costs and weaker buyer demand simultaneously.
i
The Interest Rate Transmission
Oil shocks create inflation, which pressures the Fed to keep rates high. Higher rates raise mortgage costs. Higher mortgage costs cool housing demand. The link between a barrel of crude oil and a home purchase is indirect but historically consistent.
Section 09
Employment and the Labor Market
The employment effects of oil price shocks operate through several distinct channels that sometimes pull in opposite directions, creating a complex net outcome for the U.S. labor market.
Sector
Employment Effect of High Oil
Direction
Speed of Impact
Oil and gas extraction
Hiring surge as drilling ramps up
Positive
3 to 12 months
Airlines
Layoffs when fuel costs overwhelm revenue
Negative
6 to 18 months
Trucking and logistics
Small operator failures; large company cutbacks
Negative
3 to 9 months
Retail and consumer goods
Sales slowdown as consumers cut discretionary spending
Negative
1 to 6 months
Agriculture
Cost squeeze, some farm consolidation risk
Negative
Seasonal
Manufacturing
Mixed; energy-intensive sectors suffer, defense/exports may gain
Mixed
6 to 18 months
Renewable energy
Increased investment as alternatives become more competitive
Positive
12 to 36 months
Construction (energy infrastructure)
Pipeline, refinery, and LNG terminal hiring increases
Positive
6 to 24 months
The historical pattern is that sustained high oil prices tend to be a net negative for total U.S. employment, because the jobs gained in the energy sector do not fully offset the jobs lost in transportation, manufacturing, and consumer-facing industries. The 1973 and 1979 oil shocks both preceded significant unemployment spikes. The 2008 oil price surge contributed to labor market deterioration heading into the financial crisis.
That said, the U.S. economy in 2026 entered the oil shock with a labor market that was already showing signs of softening. The pace of hiring had remained relatively weak, and the impact of oil-driven inflation could spill over into the labor market in the medium term, as RBC Economics warned, “exacerbating the cyclical weakness that we have been experiencing.”
Section 10
Historical Oil Shocks and U.S. Recessions: A Consistent Pattern
Every major U.S. recession since World War II has been preceded or accompanied by a significant oil price spike. This is not coincidence. It is causation.
The Federal Reserve Bank of St. Louis found that the average real energy price increase preceding the four recessions between 1973 and 1991 was 17.5 percent, and in each case the shock compounded pre-existing inflation dynamics. The history of oil shocks provides the clearest possible evidence that energy market disruptions have macroeconomic consequences that are both severe and predictable.
1973
OPEC Arab Embargo (1973-1974)
The Arab oil embargo sent crude prices up 366 percent. U.S. GDP contracted 3.2 percent in 1974, the worst year since the Great Depression. Unemployment rose from 4.8 to 9.0 percent. Inflation hit 11 percent. The result was textbook stagflation: high inflation, high unemployment, and low growth occurring simultaneously, creating a policy dilemma that the Fed could not resolve with conventional tools.
1979
Iranian Revolution and Second Oil Shock (1979-1980)
The Iranian Revolution removed Iran’s 5.7 million barrel per day production capacity from global markets. Prices roughly doubled again on an economy still scarred from 1973. Fed Chair Paul Volcker ultimately raised rates to 20 percent to break inflation’s back, but that cure created a severe recession of its own. The economy contracted sharply in 1980 and again in 1982.
1990
Gulf War and 1990 Oil Spike
Iraq’s invasion of Kuwait triggered a sharp oil price spike in mid-1990. A brief but sharp recession followed. Unlike the 1970s shocks, the Fed under Greenspan responded with accommodation rather than aggressive tightening, limiting the depth and duration of the downturn, though a recession still occurred.
2008
2007-2008 Surge and the Financial Crisis
Oil prices surged from around $60 per barrel in 2006 to a peak of $147 per barrel in July 2008. While the financial crisis was the dominant cause of the subsequent recession, the oil price spike materially weakened the consumer and contributed to the economic deterioration that made the financial shock so devastating. Global demand peaked in May 2008 and collapsed in the second half of the year.
2020
COVID Collapse and Negative Oil Prices (2020)
In April 2020, WTI crude briefly traded at negative $37 per barrel as storage facilities overflowed and demand evaporated. The subsequent demand recovery drove prices sharply higher by 2021 and 2022, contributing to post-pandemic inflation that peaked at 9.1 percent in June 2022.
2026
Iran War and Strait of Hormuz Crisis (2026)
U.S. and Israeli strikes on Iran on February 28, 2026 triggered what the IEA characterized as the largest supply disruption in the history of the global oil market. Brent crude approached $120 per barrel. Economists draw parallels to 1990 in terms of shock character and policy response dynamics, though the scale of the disruption has 1970s echoes.
U.S. Economic Impact of Major Oil Shocks: Key Indicators at Peak Disruption
Sources: Federal Reserve History, Bureau of Labor Statistics, EIA, RIA Research 2026
Section 11
The 2026 Crisis: What Is Happening Right Now
The economic shock of 2026 is not a forecast. It is already unfolding in real time, in paychecks, grocery receipts, gas stations, airline booking systems, and Federal Reserve meeting minutes.
Live: 2026 Energy Crisis
Key Developments: February through June 2026
U.S. and Israeli forces launched joint air strikes on Iran on February 28, 2026. Within days, Brent crude futures soared from $65 to $98 per barrel, eventually approaching $120, as attacks on Iran’s oil infrastructure and the closure of the Strait of Hormuz disrupted the flow of roughly 20 percent of the world’s daily oil supply.
The IEA characterized the disruption as the largest supply shock in the history of the global oil market, triggering an unprecedented coordinated release of 400 million barrels from member nations’ emergency oil reserves on March 11, 2026, to mitigate the impact.
The EIA’s May Short-Term Energy Outlook forecast Brent crude averaging $105 per barrel in June and July 2026, based on assumptions that the Strait of Hormuz remains closed to most shipping traffic in the near term, with prices expected to fall back toward $79 per barrel in 2027 as flows gradually resume.
Diesel prices reached $4.65 per gallon nationally by mid-March, a 23 percent jump from pre-war levels. The EIA projected wholesale diesel prices would rise more than 60 percent in 2026 compared to its pre-conflict February forecast, with jet fuel up more than 60 percent as well.
PCE inflation jumped from 2.9 percent in February to 3.8 percent in April 2026, driven primarily by energy price increases. Deutsche Bank analysts wrote that they expected a 25 percent increase in gasoline prices to put significant upward pressure on overall CPI readings.
The USDA revised its 2026 “food at home” inflation forecast to 3.1 percent, nearly double the projection made at the start of the year, as energy costs pushed up the entire food supply chain.
United Airlines CEO Scott Kirby said ticket prices may need to rise 20 percent. Forbes found summer 2026 airfare was already up 17 percent year over year. International flight cancellations across the Middle East sharply reduced global air passenger volumes.
Energy companies in the S&P 1500 added roughly $475 billion in market capitalization since the start of 2026, even as most stock indices fell in the early weeks of the conflict before recovering. J.P. Morgan maintained a Brent crude average forecast of around $60 per barrel for the full year, reflecting an expectation that the disruption would not prove permanent.
Oxford Economics forecast that 2026 will bring the slowest annual consumption growth since 2013, excluding the pandemic. The IMF managing director warned that the oil shock could effectively undo recent inflation progress and slow global economic growth, stating publicly: “Think of the unthinkable and prepare for it.”
“Can’t underscore what a massive jolt this is to the system.”
U.S. energy analyst, March 10, 2026, as oil surpassed $110 per barrel
Section 12
Outlook: What Comes Next for Oil and the Economy
The near-term outlook for oil prices in 2026 is shaped by two competing forces: the supply disruption from the Iran conflict on one side, and soft underlying demand fundamentals plus OPEC spare capacity and U.S. production growth on the other.
J.P. Morgan Global Research maintained a Brent crude average forecast of around $60 per barrel for 2026 before the conflict, reflecting what was a genuinely bearish supply-demand backdrop. That baseline has been dramatically disrupted. The EIA’s May 2026 Short-Term Energy Outlook, accounting for the conflict, projected Brent averaging $105 per barrel in June and July before declining toward $79 per barrel in 2027 as Strait of Hormuz flows gradually resume. WTI forecasts for 2026 as a whole had ranged from $49 to $57 per barrel in analyst consensus surveys compiled before the conflict, making the actual outcome dramatically higher than pre-war expectations.
Scenarios for the Second Half of 2026
Scenario
Oil Price Range (Brent)
Inflation Outlook
GDP Impact
Probability
Quick Resolution (Hormuz reopens, Iran deal)
$65 to $80/bbl
Eases to ~3%
Mild drag, avoids recession
Moderate
Prolonged Disruption (6 to 12 months)
$90 to $115/bbl
Rises to 4% to 5%
Significant contraction risk
Moderate-High
Escalation (wider regional conflict)
$120 to $150+/bbl
Potential stagflation
Likely recession
Lower but elevated
U.S. Production Surge Offsets Shortfall
$75 to $95/bbl
Stabilizes ~3.5%
Sluggish but positive growth
Moderate
The wildcard in all of these scenarios is the U.S. domestic supply response. American shale producers can, in theory, ramp up production to partially offset Middle Eastern supply losses. But with average breakeven costs for new wells at $61 to $70 per barrel, and given that drilling decisions require capital commitments and lead times of many months, the supply response is unlikely to be immediate enough to meaningfully calm the 2026 price spike. Longer term, sustained high prices would incentivize the investment cycle needed to grow production, which in turn would eventually moderate prices, the classic boom-bust cycle of the oil industry.
+
The Long-Run Energy Transition Factor
Each major oil shock accelerates the energy transition. Higher prices make electric vehicles, solar power, and energy efficiency investments more economically attractive. The oil shocks of the 1970s produced the first wave of American fuel economy standards and alternative energy investment. The 2026 crisis may similarly accelerate the adoption of EVs, heat pumps, and renewable electricity that reduce long-run oil dependence.
Conclusion: Oil Still Runs the World, and 2026 Proves It
Decades of research, reinforced by the dramatic events of 2026, confirm a simple and uncomfortable truth: despite every advance in renewable energy, electric vehicles, and energy efficiency, crude oil still runs the foundational infrastructure of modern American economic life. When its price moves sharply, there is nowhere to hide.
The 2026 Iran war and the resulting Strait of Hormuz disruption represent one of the most dramatic oil market events in a generation. The immediate effects are already visible at gas stations, in grocery stores, on airline booking sites, and in Federal Reserve meeting minutes. The longer-run effects on housing affordability, employment, consumer confidence, and economic growth will unfold over months and years.
The historical record is unambiguous: sustained oil price spikes precede recessions. Whether 2026 follows that pattern depends on how quickly the supply disruption resolves, how the Federal Reserve navigates the inflation-growth tradeoff, and how resilient American consumers prove to be in the face of a cost of living shock that is hitting them on multiple fronts simultaneously.
What is not uncertain is the lesson every American consumer and investor should internalize: in a world where a single conflict thousands of miles away can raise the price of every good and service you buy within weeks, understanding oil economics is not optional. It is essential financial literacy.