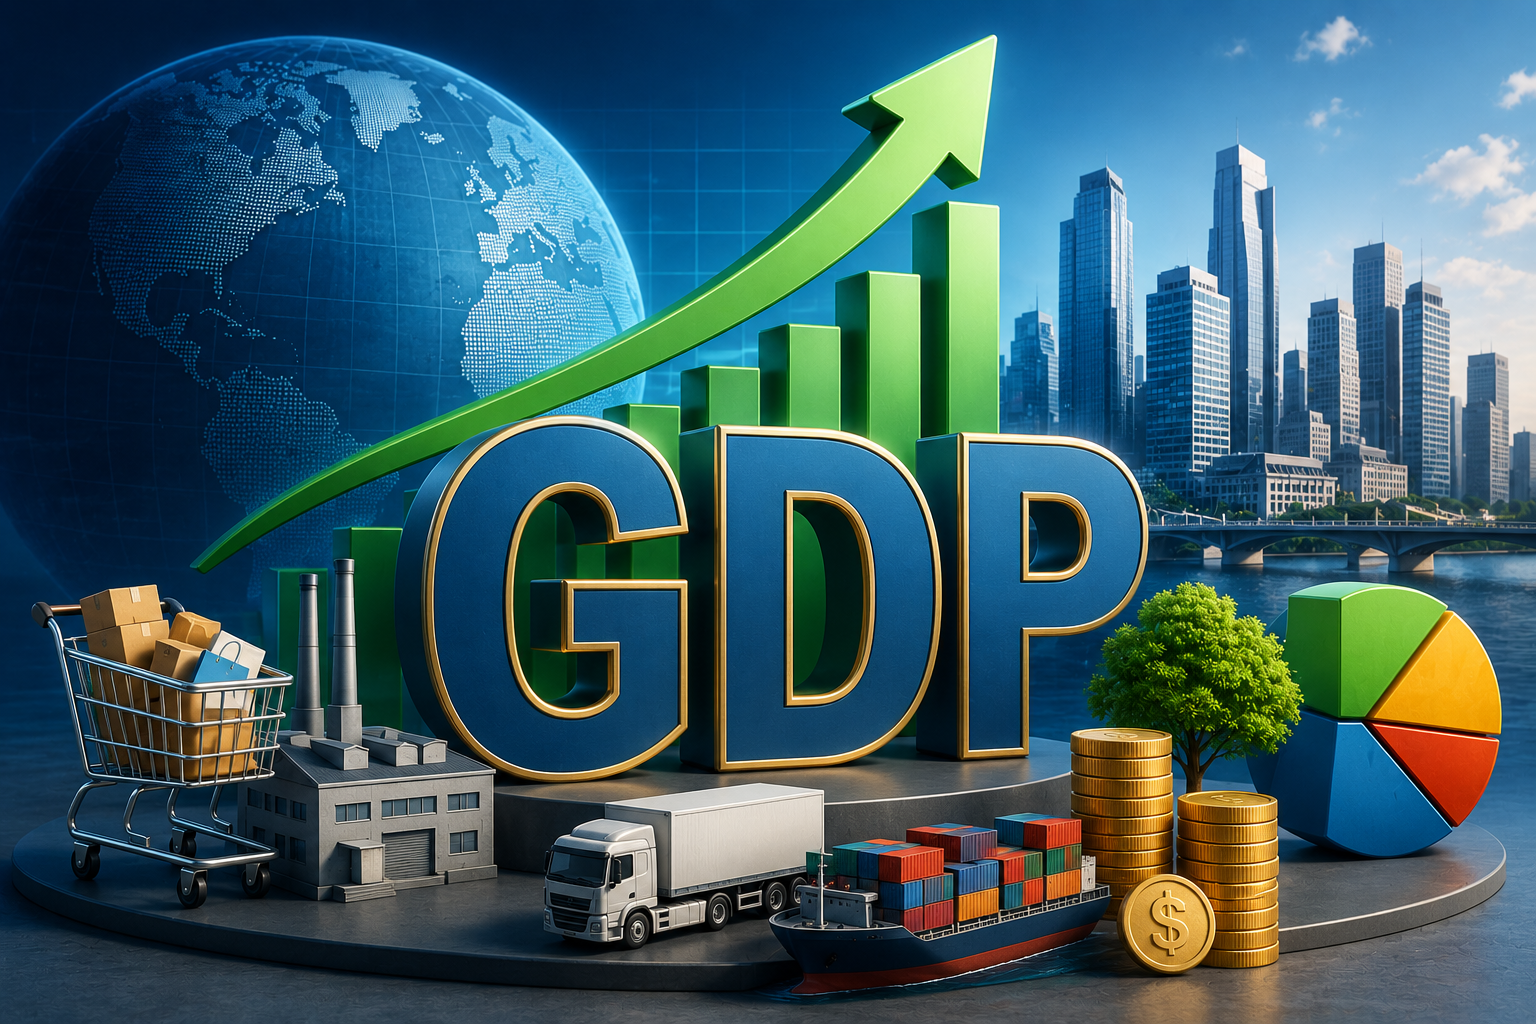
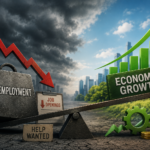
Gross Domestic Product, widely known as GDP, is the most influential metric in the world of macroeconomics. It serves as an ultimate report card for a country’s economic health. When news anchors report that the economy is expanding or heading into a contraction, they are almost always referring directly to fluctuations in this single metric.
Understanding how GDP is structured, calculated, and utilized provides essential insight into everyday life. It explains why central banks raise interest rates, why companies suddenly freeze hiring, and how global events reshape personal finances.
This comprehensive guide breaks down the core elements of Gross Domestic Product, examines its calculation methods, highlights why it remains critical to investors and policymakers, and integrates the latest global economic data.
1. What Is Gross Domestic Product?
Gross Domestic Product is the total monetary or market value of all finished goods and services produced within a country’s borders during a specific time period. Because it measures total domestic output, it acts as a comprehensive scorecard of a given nation’s economic health.
To understand the core definition, we must look at three specific terms within the name itself:
Gross: This means the total value is measured before accounting for capital depreciation (the natural wear and tear that happens to machinery, factories, and vehicles over time).
Domestic: The production must physically occur within the geographic boundaries of the nation. For example, a Japanese automaker producing vehicles at a manufacturing plant in Ohio contributes directly to the GDP of the United States, not Japan.
Product: The metric focuses exclusively on final, completed goods and services sold to an end user.
2. Real GDP vs. Nominal GDP: The Impact of Inflation
Raw economic output figures can be highly deceptive if you do not filter out the distorting effects of inflation. Because of this, economists divide the data into two primary metrics: Nominal GDP and Real GDP.
Nominal GDP
Nominal GDP tracks the total value of all finished goods and services using current market prices. If a country produces 100 bicycles in Year 1 at $100 each, its Nominal GDP is $10,000. If in Year 2 the country produces the exact same 100 bicycles but inflation drives the price up to $110 each, the Nominal GDP rises to $11,000.
Looking solely at the nominal figure suggests the economy grew by 10%. In reality, actual production did not change at all. The country did not become more productive; things simply became more expensive.
Real GDP
Real GDP solves this distortion by adjusting the total output value relative to a designated base year, holding prices constant. By tracking output using fixed, historical prices, Real GDP eliminates the phantom growth caused by inflation.
Using the bicycle example, Real GDP would value Year 2 production using the baseline price from Year 1 ($100). The resulting value would stay exactly at $10,000, revealing that the true underlying growth rate was a flat 0%.
Whenever policymakers, major media outlets, or international financial organizations quote economic growth statistics, they are almost exclusively utilizing Real GDP because it reflects actual volume changes in economic output.
3. How GDP Is Calculated: Three Proven Methods
The field of macroeconomics evaluates economic performance using three distinct, theoretically equivalent calculation frameworks. Because every dollar spent by a buyer becomes a dollar of income for a seller, these three approaches arrive at the exact same final figure.
The expenditure method is the most widely recognized framework for analyzing economic health. It tabulates the total spending patterns of four distinct economic groups within the country:
Interactive GDP Component Formula Builder
Adjust the levers below to simulate the expenditure equation: GDP = C + I + G + (X – M). See how shifts in consumer spending or changing trade balances alter the overall national economic scale and re-weight component shares in real time.
Calculated Aggregate GDP
$27,500 B
Total National Output Value
Net Exports Balance (X – M)
-$1,000 B
Trade Deficit
Consumption (C): 69.1%
Investment (I): 18.2%
Government (G): 16.4%
Net Trade: -3.6%
Personal Consumption Expenditures (C)$19,000 B
Gross Private Domestic Investment (I)$5,000 B
Government Consumption & Investment (G)$4,500 B
Gross Exports (X)$3,000 B
Gross Imports (M)$4,000 B
GDP = C + I + G + (X - M)
Consumption (C): Private consumer spending by individuals and households. This encompasses durable goods (refrigerators, cars), non-durable goods (food, fuel), and services (healthcare, legal counsel, haircuts). For advanced economies like the United States, consumer spending is the primary economic engine, frequently dictating roughly 70% of total economic activity.
Investment (I): Gross private domestic investment. This represents spending by business enterprises on capital goods designed to generate future economic value. Examples include the construction of new factories, the purchase of software, business inventory updates, and residential housing construction. It does not include standard stock market transactions or bond purchases, as those are financial reallocations rather than direct physical investments.
Government Spending (G): Total consumption and investment outlays made by local, state, and federal government entities. This includes infrastructure spending, civil servant payrolls, and defense procurement. It explicitly excludes transfer payments like social security or unemployment benefits, because those funds are redistributed rather than spent directly on new goods or services.
Net Exports (X – M): The net value of global trade. This is calculated by taking total exports (goods and services produced domestically and sold overseas, X) and subtracting total imports (goods and services produced abroad and purchased by domestic buyers, M). If a nation exports more than it imports, it logs a trade surplus, which adds to its GDP. If it imports more than it exports, it runs a trade deficit, which acts as a net deduction from total GDP.
2. The Income Approach
The income approach calculates economic output from the opposite perspective. It totals the earnings generated by all local factors of production. The primary components of this calculation include:
Compensation of Employees: Total wages, salaries, healthcare contributions, and pension benefits paid to workers.
Gross Operating Surplus: The corporate profits earned by businesses, along with the proprietor income generated by self-employed workers.
Taxes Less Subsidies: Any production or import taxes collected by government authorities, minus any business subsidies distributed back into the market.
3. The Production (Value-Added) Approach
The production method focuses on the exact value added to a product at each individual stage of development. To calculate this, economists take the gross market value of finished output and subtract the cost of intermediate consumption used during production. This method is incredibly useful for mapping out which industries (such as manufacturing, technology, or agriculture) are driving the lion’s share of national wealth creation.
4. Current Economic Context: 2026 Trends and Structural Risks
Global GDP data in 2026 reveals an economy confronting significant structural headwinds and shifting growth paths. According to the latest half-yearly report from the World Bank, global growth is projected to slow to 2.5%. This marks the weakest pace of global economic expansion since the pandemic recovery era, down slightly from the 2.7% growth tracked in 2025.
A major driver of this structural deceleration is ongoing geopolitical tension in the Middle East. This conflict has disrupted shipping lanes, caused noticeable spikes in commodity prices, and led to upward pressure on global headline inflation, which is expected to touch 4.0%. The International Monetary Fund (IMF) also notes that rising public debt levels and altered trade patterns are putting pressure on emerging markets and commodity-importing economies. In a worst-case downside scenario where energy flows face persistent disruptions, international agencies warn that global growth could fall to a sharp 1.3%.
In the United States, data from the Bureau of Economic Analysis (BEA) shows that first-quarter 2026 Real GDP expanded at an annualized rate of 1.6%.
U.S. GDP Component (Q1 2026 BEA Data)
Performance and Market Context
Headline Annualized Real Growth
1.6% — Rebounding from a weak 0.5% in Q4 2025, though revised down from the initial 2.0% estimate due to lower inventory investments.
Private Domestic Demand
2.4% — Real final sales to private domestic purchasers remained healthy, outperforming the top-line figure.
Government Spending
4.4% — Rebounded sharply from a temporary 5.6% contraction in late 2025 that followed a federal government shutdown.
Consumer Spending Growth
1.4% — Showing signs of moderation as households navigate elevated services prices and restrictive financing costs.
This mixed data highlights the complex balancing act currently facing central banks worldwide. On one hand, private demand and government outlays are providing baseline economic support. On the other hand, moderating consumer spending and stubborn services inflation complicate the path toward lower interest rates.
5. Why GDP Matters to Everyday Life
Gross Domestic Product is far more than a dry spreadsheet figure utilized by academic researchers. It has immediate, practical implications for the global workforce, financial markets, and business operators.
1. Job Creation and Employment Opportunities
There is a direct correlation between the rate of GDP expansion and the health of the labor market. When businesses see sustained demand for finished products, they expand operations, invest in equipment, and hire more workers.
Conversely, when production contracts, corporate revenue falls, leading businesses to implement hiring freezes or layoffs. A classic rule of thumb in economics is that a sustained drop in growth is almost always accompanied by a noticeable rise in unemployment.
2. Corporate Earnings and Stock Market Volatility
For equity investors, GDP acts as an overarching tide that lifts or lowers corporate boats. Healthy economic expansion drives consumer spending, which boosts top-line revenue for publicly traded firms.
When macro economic growth misses projections, it often triggers downward revisions to corporate earnings forecasts, sparking volatility across global stock exchanges.
3. Monetary Policy and Interest Rates
Central banks, such as the Federal Reserve or the European Central Bank, look closely at GDP data when setting monetary policy.
When GDP is growing too fast: This rapid expansion can push the economy past its full capacity, causing supply chain bottlenecks and fueling inflation. To cool things down, central banks typically raise interest rates, making borrowing more expensive for car loans, mortgages, and business expansion.
When GDP is sluggish or shrinking: Central banks often take the opposite approach. They cut interest rates and inject liquidity into the banking system to make credit cheaper, encouraging businesses to invest and consumers to spend.
6. Alternative Metrics: What GDP Leaves Out
While GDP remains the foundational metric for macroeconomic analysis, it is not a perfect tool. Over the years, economists have noted several key limitations, leading to the development of alternative tracking measures.
1. The Exclusion of Non-Market Transactions
GDP only calculates transactions that occur within official, recorded markets. This means it completely overlooks vital economic contributions like household caregiving, volunteer labor, and unpaid domestic work. Furthermore, it cannot accurately capture transactions that occur within informal or shadow economies.
2. Income Inequality and Wealth Distribution
GDP measures the aggregate size of an economy, but it tells us nothing about how that wealth is distributed among citizens. A nation can log a high GDP per capita (total GDP divided by the population) while the vast majority of its financial gains are concentrated among a small percentage of the population, leaving a significant portion of the workforce facing economic hardship.
3. Environmental and Ecological Degradation
GDP tracks the value of what we produce, but it ignores the environmental costs of that production. If an industrial complex manufactures millions of dollars worth of finished products but pollutes a local water supply or accelerates deforestation, GDP records the manufacturing revenue as a positive gain while completely ignoring the long-term ecological damage.
Modern Alternative Metrics
To capture a more complete picture of societal health, international analysts frequently look at alternative indices alongside traditional GDP data:
Gross National Happiness (GNH): Pioneered by Bhutan, this framework measures economic development based on holistic factors like psychological well-being, cultural preservation, health, and environmental sustainability.
Human Development Index (HDI): Created by the United Nations Development Programme, the HDI combines GDP per capita data with metrics tracking life expectancy and educational attainment to evaluate a nation’s true quality of life.
Genuine Progress Indicator (GPI): This metric starts with standard consumption data but adjusts the final figure downward to account for negative factors like income inequality, environmental pollution, and crime rates.
7. The Lifecycle of an Economy: Recessions and Depressions
Economies do not grow in a straight, uninterrupted line. Instead, they move through natural phases of expansion and contraction known as the business cycle. Understanding these shifts is vital for managing economic risk.
Expansion: This is the healthy upward phase of the cycle, characterized by rising employment, growing consumer confidence, and steady growth in real GDP.
Peak: The highest point of the business cycle, where growth hits its maximum capacity. This turning point often creates inflationary pressures as demand begins to outstrip supply.
Contraction (Recession): A downward phase where economic activity slows down. The most common technical definition of a recession is two consecutive quarters of declining Real GDP. During a recession, consumer spending drops, business revenues fall, and unemployment ticks upward.
Trough: The lowest point of the economic contraction. Once the economy bottoms out at the trough, it transitions back into an expansion phase, restarting the entire cycle.
When a recession is exceptionally severe and prolonged, it is classified as an economic depression. While a recession typically lasts for several quarters, a depression can persist for years, causing widespread banking crises, steep drops in global trade, and double-digit unemployment rates.
8. Essential Links and Authoritative Economic Sources
To stay updated on changing GDP revisions, macroeconomic announcements, and policy adjustments, you can follow these official regulatory and statistical reporting bodies:
U.S. Bureau of Economic Analysis (BEA): The official government agency responsible for calculating and publishing United States GDP estimates, corporate profit updates, and personal income statistics.
World Bank Data Bank: A premier open-source repository for global economic development indicators, tracking long-term GDP growth, poverty rates, and regional industrial trends across nations.
Summary Checklist: Key Takeaways
GDP measures the total market value of all finished goods and services produced within a country’s borders during a specific timeframe.
Real GDP is adjusted to remove the distorting effects of inflation, making it the preferred metric for tracking true long-term economic growth.
The Expenditure approach tracks spending across four main areas: Consumption, Private Investment, Government Spending, and Net Exports.
Recent global reports highlight structural headwinds, forecasting a slowdown in global growth to 2.5% due to supply chain challenges and geopolitical tensions.
While GDP is an incredibly powerful tool for assessing economic scale, it does not measure wealth inequality, non-market labor, or environmental sustainability.