The foreign exchange marketplace in mid 2026 is experiencing structural upheaval. Algorithmic execution, quantitative modeling, and profound policy updates from major central banks have completely rewritten the rules of retail and institutional alpha generation. Long gone are the predictable, low volatility environments of yesterday. Today, executing an optimized, profitable curriculum requires a deep understanding of macroeconomic data, systemic policy updates, and clear technical rules.
Most notably, under the leadership of newly appointed Fed Chair Kevin Warsh, the Federal Reserve has delivered a hawkish surprise to global markets. Rather than prioritizing employment metrics, the modern FOMC has narrowed its focus strictly to structural inflation. This monumental policy change has pushed US Treasury yields higher, caused sharp trends across major currency pairs, and brought the Japanese Yen back into dangerous intervention territory.
1. The Macro Grid: Central Bank Policy and Key Drivers
To build a reliable forex trading strategy right now in 2026, you must align your frameworks with the shifting priorities of global central banks. The market is currently driven by a stark policy divergence.
The New Federal Reserve Regime
The Federal Reserve has undergone an extensive communication overhaul aimed at simplifying regular statements and prioritizing pure price stability. The market has quickly recalibrated to expect a potential rate hike as early as October 2026. This hawkish turn has provided substantial fundamental support to the US Dollar Index, putting downward pressure on raw commodities and risk correlated assets alike.
The Japanese Yen Dilemma
The widening yield differential between the United States and Japan has propelled USD/JPY back toward the critical 160.00 region, a level that historically forced direct physical intervention from the Japanese Ministry of Finance. Traders tracking this pair must balance structural trend continuation parameters against the immediate threat of sudden, multi hundred pip downside interventions.
European Neutrality and Regional Tensions
While June has historically been a strong seasonal period for the Euro, ongoing supply channel issues and geopolitical tensions have disrupted standard market behavior. The EUR/USD remains fundamentally fragile below the 1.1500 threshold, leaving it highly vulnerable to sudden capital outflows if the Fed continues its aggressive policy stance.
The British Pound and Bank of England
The Bank of England has adopted a considerably more dovish tone compared to the Fed, pushing expectations for its next rate hike back toward late September 2026. Coupled with domestic political uncertainties, the GBP/USD continues to exhibit distinct technical weakness.
2. Definitive Forex Strategy Blueprints for 2026
The following implementation setups are customized for the current market environment. They combine classical technical rules with strict modern risk parameters.
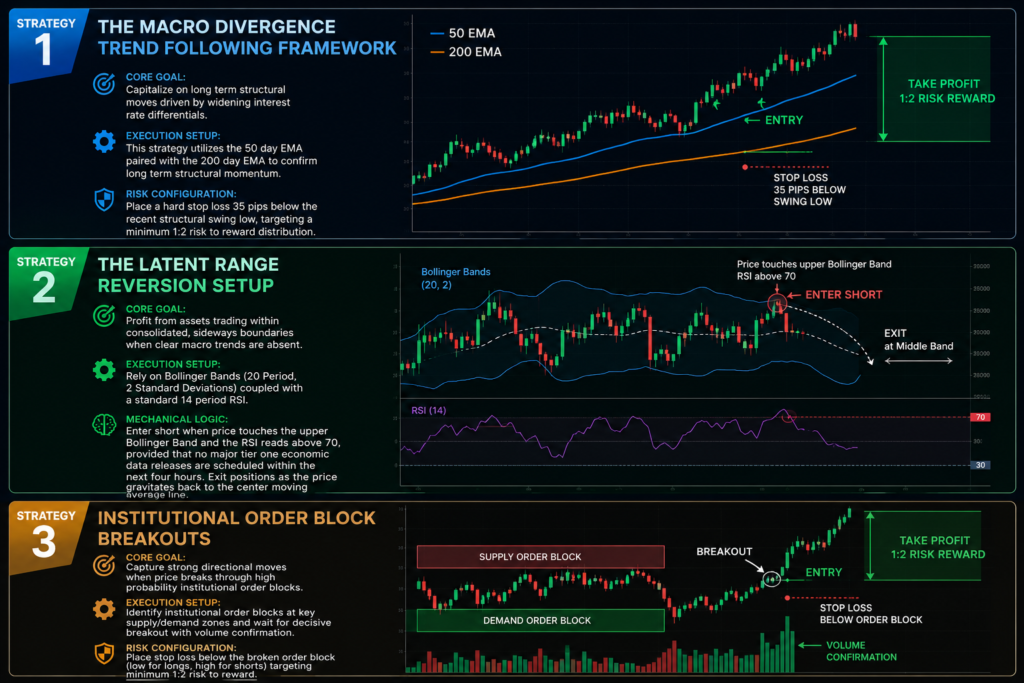
Strategy 1: The Macro Divergence Trend Following Framework
Core Goal: Capitalize on long term structural moves driven by widening interest rate differentials.
Execution Setup: This strategy utilizes the 50 day Exponential Moving Average (EMA) paired with the 200 day EMA to confirm long term structural momentum.
Risk Configuration: Place a hard stop loss 35 pips below the recent structural swing low, targeting a minimum 1:2 risk to reward distribution.
Strategy 2: The Latent Range Reversion Setup
Core Goal: Profit from assets trading within consolidated, sideways boundaries when clear macro trends are absent.
Execution Setup: Rely on Bollinger Bands (20 Period, 2 Standard Deviations) coupled with a standard 14 period Relative Strength Index (RSI).
Mechanical Logic: Enter short when price touches the upper Bollinger Band and the RSI reads above 70, provided that no major tier one economic data releases are scheduled within the next four hours. Exit positions as the price gravitates back to the center moving average line.
Strategy 3: Institutional Order Block Breakouts
Core Goal: Identify areas where commercial institutions are quietly accumulating large positions.
Execution Setup: Locate distinct congestion zones followed by an aggressive, high volume breakout candle.
Mechanical Logic: Wait for a formal return and retest of the original order block zone before executing an order in the direction of the initial breakout momentum. This filters out low volume false breakouts.
3. High Probability Strategy Matrix
Evaluating execution timeframes against your personal risk tolerances is essential for keeping drawdowns within acceptable parameters. The following comparison table maps out the core parameters of the main strategies used in the current market environment.
Trading Strategy
Base Timeframe
Target Risk to Reward Ratio
Primary Macro Trigger
Technical Validation Tool
Trend Following
4-Hour / Daily
1:2 to 1:4
Central Bank Interest Rate Divergence
Dual Exponential Moving Averages
Range Trading
15-Min / 1-Hour
1:1.5 to 1:2
Periods of Seasonal or Holiday Consolidation
RSI & Bollinger Bands
Breakout Trading
1-Hour / 4-Hour
1:2 to 1:3
Tier-1 Data Releases (NFP, FOMC Decisions)
High Volume Support & Resistance Violation
Carry Trading
Daily / Weekly
Variable
Wide, Sustained Yield Differentials
Forward Swap Points & Long Term Macro Health
4. Modern Risk Mitigation and Account Protection
In an era dominated by high speed algorithmic systems, manual account management must rely on absolute discipline. The current volatility metrics mean that improper capital allocation can erase months of profitability in a single trading session.
The Two Percent Rule: Never risk more than 1% to 2% of total capital on a single execution. Position size must be calculated backward from the stop loss distance, rather than picked arbitrarily.
Total Exposure Limits: Keep your aggregate market exposure under 15% of your total account valuation. Spreading trades across multiple USD cross pairs does not represent true diversification if a major FOMC event impacts the entire asset class.
Execution Latency Awareness: Scalping and rapid intraday execution models now require a raw spread ECN account environment. Standard retail brokerage accounts often introduce substantial execution slippage during news events like the FOMC statement release, easily turning a winning setup into an immediate loss.
5. Strategic Implementation Roadmap
To successfully deploy these strategies without exposing your capital to unmanaged risk, follow this structured execution plan.
1.Infrastructure Optimization: Platform Setup.
Select a highly reliable execution platform supporting low latency orders, such as MT5 or a dedicated institutional cTrader terminal. Ensure access to a raw spread ECN environment to keep execution costs low.
2.Central Bank Alignment: Macro Analysis.
Review the global economic calendar weekly, paying close attention to policy shifts like the Hawkish Fed adjustments. Group currencies into strong or weak categories based on their monetary policy paths.
3.Structure and Indicator Setup: Technical Filter.
Apply your technical filters to the charts, using tools like the 50 and 200 EMAs to confirm the market structure. Avoid using counter trend strategies in high velocity, news driven markets.
4.Rigorous Forward Testing: Validation Phase.
Test your chosen trading strategy on a live demo account for at least 30 to 60 days. Document all executions in a trading journal to track win rates, drawdowns, and emotional consistency before risking live capital.
6. Live Interactive Market Simulation
To visualize how shifts in central bank policy, execution delays, and strategy choices directly affect your equity curve, use the lightweight dashboard below. This simulated environment lets you test your approach against different market regimes before committing live trading capital.
Live Interactive Market Simulation
Adjust the variables below to observe how execution latency, regime changes, and risk parameters interact to alter your simulated net alpha yield over 100 sessions.